


Looking for Low Brokerage, High Margin & Free Tips?
Candlestick Patterns
More on Online Share Trading
Candlestick patterns are not just some random tools to share market analysis, they are part of an armoury. Ask any expert trader, he/she will vouch for their importance.
At the same time, candlestick charts, also known as Japanese Candlestick Charts are one of the most important financial tools used in technical analysis of stocks.
Candlestick patterns are made out of the combination and permutations of these different candlestick types.
Candlestick Patterns Meaning
A candlestick represents four key prices of trading stock or index, namely:
- Open: This is the first price at which a trade gets executed when markets open in the morning.
- High: This is the highest price at which a trade could be executed during the trading day.
- Low: This is the lowest price at which a trade could be executed during the trading day.
- Close: This is the last price at which the markets got closed.
Different colours of the candlesticks represent bullish or bearish behaviour. Any set of colours can be used to show bullish and bearish candlesticks like white for bullish and black for bearish or green for bullish and red for bearish.
Let us see how bullish and bearish candlesticks look like and what their structures are:
Bearish Candlestick Patterns:
The structure of a bearish candlestick consists of three parts:
- Body: The central body represents the opening and closing price. Open is always higher than closing in a bearish candlestick.
- Head: The head of the candlestick, also known as the upper shadow connects the opening price to the high price.
- Tail: The tail of the candlestick, also known as the lower shadow connects close price to the low price.
Bullish Candlestick Patterns:
The structure of a bearish candlestick also consists of three parts:
- Body: The central body represents the opening and closing price. Open is always lower than closing in a bullish candlestick.
- Head: The head of the candlestick connects close price to the high price.
- Tail: The tail of the candlestick connects open price to the low price.
The candlesticks can be of different sizes depending on the trading activity. For example, the long-bodied candlesticks represent strong buying or selling activity whereas, the short-bodied candlesticks represent less buying or selling activity.

Candlestick charts can be made for different time frames like monthly, weekly, daily or intraday charts (30 minutes, 15 minutes, etc.).
Candlestick Patterns Trading Strategy
Candlestick patterns are used in currency trading as well with the use of multiple strategies.
However, using a specific strategy varies from one trader to another and of course the final way the strategy gets executed.
For instance, we will be discussing 13 different candlestick patterns in this review ahead and you will realize that each pattern comes with its own sets of pre-conditions and thus, using one single strategy might not work (and it does not really work at all).
Let’s take an example of understand what it actually means in real-time trading. Let’s say the market trend is forming a bullish engulfing pattern. Now, such a pattern is a pre-signal for an upward market movement.
Thus, the pattern, in a sense, has informed you that the market is going to be bullish from here.
Just place a target price along with a stop-loss and let the trade magically bring profit to you!
Candlestick Patterns Analysis
Studying candlestick chart analysis helps traders in identifying patterns, which ultimately helps them to make trading decisions. These patterns can be formed by single candlesticks or by a group of two or more candlesticks. Let us discuss various kinds of candlesticks under two main heads:
- Single Candlestick Patterns
- Multiple Candlestick Patterns
Single Candlestick Patterns
As the name suggests, single candlestick patterns are formed by a single candlestick. It is crucial to read them properly and execute the orders correctly. There are a number of single candlestick patterns which are discussed below:
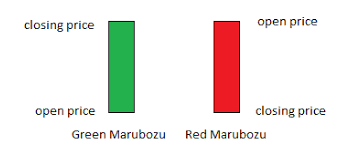
1. Marubozu:
This is a Japanese word which means “bald”. It is called so because this candlestick has neither the head nor the tail part. Therefore, it looks bald. It means that there are no significant lows or highs during the time frame.
It is of further two types: Bullish and Bearish:
2. Bullish Marubozu
In this, the Open price is almost equal to the Low price.
It signifies that the sentiment around is highly positive. During the entire day, buying of the stock continued at every price, thus making it higher and then finally closing around the high price.
It suggests that traders should consider it as a buying opportunity as it is expected that the trend will repeat itself. Buying should be done around the closing price of the marubozu.
3. Bearish Marubozu
In this, the Open price is almost equal to the High price
It signifies negative sentiment during the entire day. It means that selling activity continued at every price during that day. Therefore, the close price is almost around the low price of that day.
It suggests that traders should consider it as selling opportunity as it is expected that the trend will repeat itself. Selling should be done around the closing price of the marubozu.
Note: It is suggested that a stop-loss is always decided before entering into any trade. Whenever a trade is initiated and it appears that the trend is not identified properly or is not repeating itself, the stop-loss should be taken and the trade should be exited from.
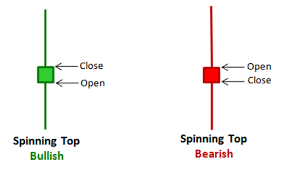
4. Spinning Tops:
Spinning tops are those candlesticks which have smaller real bodies and almost equal heads and tails. They mean two things:
- Open and close prices have almost been equal during the day. i.e. a very small movement in prices has taken place during the day. Hence, a small real body.
- The presence of head and tail mean that there was an attempt to take the stock higher as well as lower but the efforts were futile as the stock price did not move so much in either direction, which is why this candlestick has a small body.
By combining both the points together, it can be inferred that the market has been indecisive and uncertain.
Spinning Tops in Bullish Trend
If spinning tops occur in an uptrend, it may mean that the bears have made their entry in the uptrend. Either of the two things can happen after this:
- The bulls could start another round of buying
- Reversal of trend takes place in the market and it might be time to sell and earn some profits.
Spinning Tops in Bearish Trend
If spinning tops occur in a downtrend, it may mean that the bulls have made their entry in the market. Either of the two things can happen after this:
- The bears could start another round of selling
- Reversal of trend takes place in the market and it might be a buying opportunity
Identifying spinning tops candlestick patterns in an uptrend or downtrend means that one needs to be prepared for both the scenarios in both the cases and make trading decisions according to one’s risk appetite.
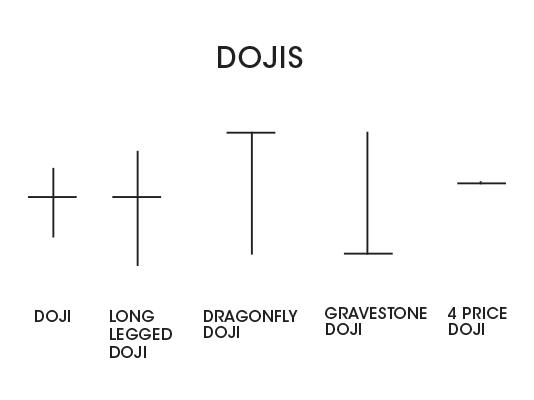
5. Doji:
Dojis are those candlesticks which do not have a real body. That means that the open price is equal to the close price. The head and the tail can be of any length.
The implications of these candlestick patterns are very similar to spinning tops. i.e. indecisiveness and uncertainty in the market and the trading decisions need to be taken accordingly depending upon the current market condition.
There are four different types of Doji patterns:
Neutral: It is a small candlestick. Open and close price of the stock is between the high and close of that particular day.
Long-legged: It is a long candlestick. Open and close price of the stock is between the high and close of that particular day.
Gravestone: The open and close price of the stock is at the low price of the day.
Dragonfly Doji Pattern: It is the exact opposite of gravestone doji. In it, the open and close price is at the high price of the day.
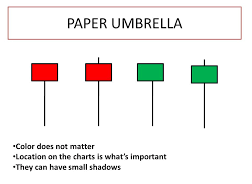
6. Paper Umbrella:
They are those single candlestick patterns which help in predicting trend reversal patterns. They have long lower shadows with small upper bodies. They are of two types:
Hammer Candlestick: When the paper umbrella is found at the bottom of a downward trend, it is termed as the hammer.
If on a day, a hammer is formed, it implies that some bulls have managed to raise the prices slightly higher to the extent that the close price of the stock is near the high price. A trader can start looking at buying opportunities here.
Hanging Man Pattern: When the paper umbrella is found at the top of an upward trend, it is termed as a hanging man.
If on a day, a hanging man is formed, it implies that some bears have managed to enter the market. A trader can start looking at shorting opportunities here.
Multiple Candlestick Patterns
Multiple candlestick patterns involve the formation of a pattern by 2 or more candlesticks. They are of different types which are discussed below:
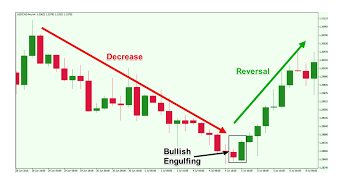
7. Bullish Engulfing Pattern:
These multiple candlestick patterns happen when there is a downtrend in the market.
The first candle of the pattern should be red confirming the bearish nature of the market and the second candle should be a green one, long enough to completely engulf the previous day’s red candle. The trader should look at buying opportunities here.
This is how it looks like:
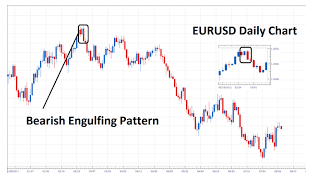
8. Bearish Engulfing Pattern:
It happens when there is an uptrend in the market.
The first candle of the pattern should be green confirming the bullish nature of the market and the second candle should be a red one, long enough to completely engulf the previous day’s green candle.
The trader should look at shorting opportunities here.
Here is a quick look:
9. Piercing Pattern:
This candlestick pattern is similar to the bullish engulfing pattern with the difference in the extent of engulfing the previous day’s red candle. In this pattern, the second day’s green candle engulfs 50% or more but less than 100% of the previous day’s red candle.
10. Dark Cloud Cover:
It is similar to the bearish engulfing pattern with the difference in the extent of engulfing the previous day’s green candle.
In this pattern, the second day’s red candle engulfs 50% or more but less than 100% of the previous day’s green candle.
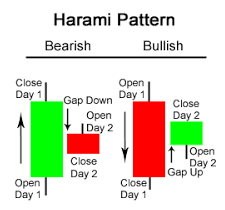
11. Harami Pattern:
These are one of the most common candlestick patterns which signify trend reversal. They are of two types depending on the nature of markets:
- Bullish Harami: It appears at the low of a downtrend. It evolves over a period of two days. The first day’s red candle shows a new low price, confirming the bearish trend. On the second day, the open price is higher than the previous day’s close price and the day manages to finish off on a positive note thus forming a small green candle.
- Bearish Harami: It appears at the top of an uptrend. It also evolves over a period of two days. The first day’s green candle shows a new high price, confirming the bullish trend. On the second day, the open price is lower than the previous day’s close price and the day manages to finish off at a negative note thus forming a small red candle.
Please check the picture below to check how they look like:
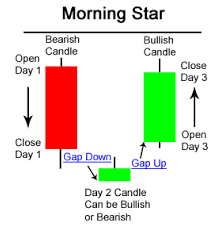
12. Morning Star Pattern:
These candlestick patterns involve a group of three candlesticks in a particular sequence which signify trend reversal in a downtrend market. They indicate buying opportunities.
- The first day’s red candle shows a new low, confirming the bearish nature.
- On the second day, there is a gap down opening, which means that the market opens at a lower price as compared to the previous day’s closing price. It shows a highly negative sentiment in the market.
- On the third day, there is a gap up opening, which means that the market opens at a higher price as compared to the previous day’s closing price. It shows a highly positive sentiment of the market. The candlestick formed on the third day is a green one and the closing price is higher than the opening price of the first day.
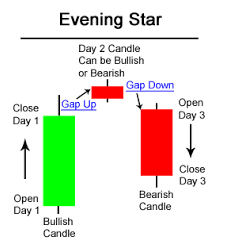
13. Evening Star Pattern:
These candlestick patterns involve a group of three candlesticks in a particular sequence which signify trend reversal in an uptrend market. They indicate shorting opportunities.
- The first day’s green candle shows a new high, confirming the bullish nature.
- On the second day, there is a gap up opening. However, the second day closes with a doji or spinning top, which signify uncertainty in the market.
- On the third day, there is a gap down opening, and the day ends with a red candle.
Candlestick Patterns Formula
In every candlestick out there, you can apply a set of formulae and identify which pattern is in the making. Once you know the upcoming pattern name to be formed, you can take corresponding trade action and make quick profits.
Looks simple, right?
Well, after a while when you consistently use these formulae, you will actually find them simple to use.
Let’s take some quick examples:
For instance, if you find the below formula to be valid, then you are looking at a bullish candlestick:
= Body is greater than (Body Average for the last 5 trading sessions) X 1.3
A Bearish Candlestick happens when:
= Body is greater than (Body Average for the last 5 trading sessions) X 0.5
Furthermore, a Marubozu is formed when:
= (lower shadow of the body) is less than (body) * 0.03
= (upper shadow of the body) is less than (body) * 0.03
A few patterns may get complicated as they may require you to check 2 or 3 even 3 pre-requisite formula to be met before a pattern is declared to be recognized.
For instance, a spinning top candlestick pattern would want the following to be correct:
= lower shadow must be greater than the body
AND
= upper shadow must be greater than the body
If you are a beginner trader then gain an in-depth understanding of the topic by referring to some of the best technical analysis books that talk about candlestick charts and patterns.
Here are a few of those books:
| Technical Analysis Books | |
| Book | Author |
| Getting Started in Technical Analysis | Jack Schwager |
| Technical Analysis Explained | Martin J. Pring |
| Technical Analysis for Dummies | Barbara Rockefeller |
| Trading and Technical Analysis Course | Mandar Jamsandekar |
| Technical Analysis of the Indian Stock Market | Shriram Nerlekar |
Conclusion:
Although understanding the candlestick patterns and executing them properly increase the probability of winning the trade, there is always a possibility of market moving in the opposite direction from what is expected. A stop-loss should always be maintained in every trade to minimise losses.
In case you are looking to get started with share market trading, just fill in some basic details in the form below.
A callback will be arranged for you:
For more on Share Market Education:
If you wish to learn more about candlestick patterns and share market investments in general, here are a few references for you:
Summary
Reviewer
A Digital Blogger
Date
Broker Name
Candlestick Patterns
Overall Rating

One Comment
I am going to share with you one very simple strategy based on a strong and easily noticeable candlestick pattern. They call it “Lucky Spike”. Everyone can learn it, use it and make money with it. There are traders who make a living trading just this pattern.