


Looking for Low Brokerage, High Margin & Free Tips?
Pivot Point Trading
| | Charts | No Comments
More on Charts
Pivot Points Trading through charts is specifically employed in order to monitor the market trends in different time frames while the trader is performing technical analysis on stocks.
How?
In the financial market space, Pivot point trading charts are used as price level indicators by the traders as a tool to understand how and in which possible direction the market will supposedly be moving. For the calculation, it uses the averages of low, high and closing price of the previous day.
Pivot Points Trading Meaning
Pivot Points, otherwise also known as Pivot Levels, are the support and resistance indicators by which you can calculate and draw the chart without much struggle.
On a literal level, the Pivot points are basically an average point when you consider the high, low and closing prices from the last trading session. Furthermore, if in the next trading session, if the trading is happening above the pivot point calculated on the last day, then there is a definite continuous bullish sentiment.
Similarly, if trading is happening below the pivot point, the sentiment can be seen as relatively bearish.
That is exactly why the Pivot Point trading charts help you to monitor the market trends in multiple time frames!
To add to that, Pivot Point Trading Charts are one of the most popularly used indicators in day trading. These charts come with a plot of support and resistance at 7 different levels that are anticipated to find turning points in the intraday market. Traders, most frequently observe the support and resistance levels by finding the previous turning points in the present market.
Thereby, the plotting of the Pivot Points gets done on a daily basis automatically.

In a sense, the traders can use the technical indicator in order to figure out the potential turning points in a trading session, when pivot point trading charts are used along. These charts can work as a marking point to identify the stop-loss level or pull-out point with profit.
It can also be used to determine the trade entry points as it helps to understand support or resistance level.
Pivot Points Trading Strategy:
When calculating pivot points, the point itself acts as primary support to trading. This point implies that the most significant price movement is expected to occur at the moment. The other resistance levels are less efficient, but still, it can generate substantial price movements.
The pivot points can be used to understand the bullish and bearish market.
And this is how this trading strategy can be used: if the pivot point price shows upward mobility or by any means is broken, then the market is certainly bullish.
Conversely, if the pivot point price shows downward mobility, it is known as a bearish movement in terms of Pivot Point Trading Charts.
Simple! Right?
How the Pivot Points Trading Charts work?
As you already know that the Pivot Point Trading Charts are a potential trading tool to identify turning points in the stock market, and based on its reading, a trader can strategize his/her trading as per the expected reversal direction.
For better results and enhancing the practical possibilities of the Pivot Point Trading Chart reading, traders generally link it with other trading indicators as well.
To explain it more precisely, you should use a 50 day Simple Moving Average reading to understand the trend and bias, when you trade only in that trend direction.
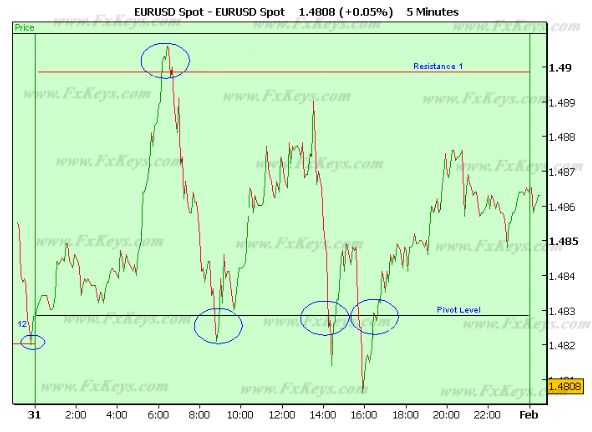
You may need a second level touch to confirm that the level can actually be classified as a turning point. This needs to be done along with the consideration of the primary touch of the pivot level. The above five-minute chart of the EUR/USD is an example of making sure the validity of a level is best before taking a trade on a basic touch.
Traders that are actively engaged in Forex Trading, use Pivot Point Trading Charts is a powerful indicator to identify the market trend. It is ideal for the intraday trader and does not offer much help for a long-term trader.
The Pivot points are becoming popular in recent days because they are a quick and easy method to find out the potential support and resistance in a market. You can find many Pivot point supporting platforms and in the event if you depend on a platform that does not support Pivot point you can use it by doing simple calculations.
For computing pivot levels three types of information from the previous day are used, and those are as follow:
- High price
- Low price
- Close Price of the previous day
Apparently, to find the high, low and close price of the previous day, you need to check the candlestick from the last day. Most of the traders tend to plot the pivot points on short period charts like the hourly and fifteen-minute charts.
Pivot values make you aware when the market will turn reverse and change the direction which helps the short-term traders as well. Pivot Point Trading Charts can indicate how and when the price will reverse and change the trend direction, which will help the day trader to strategize the trading activities.
For calculating the pivot points, the following formula is used:
- Pivot Point = (Yesterday High + Yesterday Low)/3
- Resistance 1= (Pivot Point x 2) – Yesterday Low
- Support 1 = (Pivot Point x 2) – Yesterday High
- Resistance 2 = Pivot Point + (Yesterday High – Yesterday Low)
- Support 2 = Pivot Point – (Yesterday High – Yesterday Low)
Since the price levels depend mostly on the high, low and closing level of the previous day, we can conclude that wider the range between these values the greater the distance between the levels on the following trading day.
Similarly, the smaller the trading range, the lower the distance between levels you can find on the next day.
It also has to be noted that all levels should appear on a Pivot Point Trading chart at once without any delay. This means that the scale of the price chart at some levels has not been included within the view window.
Pivot points Screener Illustration
In order to recognize market sentiments, whether bearish or bullish and also for understanding the support and resistance position of the market, traders use Pivot Point Trading Charts. This is for the simple reason that it is one of the best trading tools commonly using by many successful traders.
It has been used extensively by Forex Traders since they are particular in instruments that are highly beneficial to predict short-term trade trends, primarily when they engage in a quick trading atmosphere.
Based on various daily market trend such as low, how and trend of the previous day closing, the reading is used to calculate Pivot Point, resistance and support levels at the beginning of each day. It works as a guide to support the trading tactic during trading.
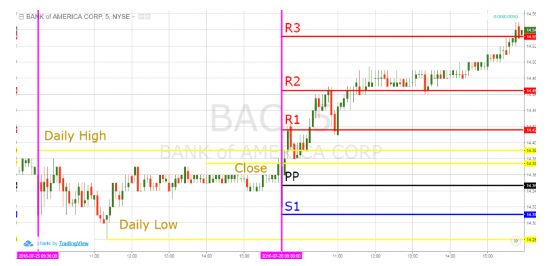
The above Pivot Point Trading Chart shows trading trends of two trading days. The pink vertical lines separate each day. We can use the first trading day to arrive the daily low, daily high and closing rate of the previous day.
Daily high is plotted as 14.39
- Daily low = 14.28
- Close = 14.37
Apply the values in the formula used for calculating pivot points.
The Pivot Point is the most critical Pivot level, which is the average of three levels, i.e., the low, high and the previous day closing price. Mathematically, it can be seen as equal to [(Yesterday High + yesterday Close + Yesterday Low)/3]
In a day in trading, if price opens under this level, it has a strong tendency to go down with strong bearish trading.
For example, we can take a simple selling system. Bulls indicate a strong position when the price opens higher to the Pivot level. Therefore when the indication denotes a strong position, you can plan for entering the market. The rest of the level may offer support and resistance positions.
Therefore you have to be mindful when the prices reach there.
In the above Pivot Point Trading Chart, you can find the price opened just above the Pivot Point and showed a tendency of acceleration. It moves up as high as the R1 level and then goes down. Traders who want to take long positions can use the Pivot Chart levels.
As a trading strategy, you can watch until the price break above the wedge before opting for an extended position.
Pivot Points Trading Strengths
Here are some of the positives of using pivot point trading charts in your technical analysis before placing trades:
- Pivot point trading charts are leading indicators to know the selling or buying the index and help you decide the targets.
- You can get to know the overall market sentiments by simple intraday trading tricks, for example, if the price is trading above the pivot point then it is bullish, and if the price is below the pivot, it is bearish.
- You can do successful trading if you use the pivot point trading charts for buying and selling.
- Price of a stock will act and react.
- Pivot point calculation is much easy, and it doesn’t need any software for calculation.
- Most of the trading platform supports pivot points, which are easy to follow and calculate.
- Huge potential for a quick profit.
- Breakouts are easy to identify and help to take necessary action.
Pivot Points Trading Weakness:
At the same time, here is a darker side of the coin with some of the concerns you may have to face:
- If the high and low of a stock is narrow, you will receive a lot of false signals. So, you MUST stay cautious.
- Price of a stock is always different from the price of its derivatives.
- Needs a lot of regulation as it requires the day trader to make quick decisions on the spot.
Pivot Points Trading Chart Conclusion:
From the above information, you should have consummated knowledge of using pivot points in your trading activities. Pivot Point Trading Charts provide a glimpse into potential future support and resistance levels in the market.
Trading with Pivot points charts are especially helpful for traders as a leading indicator to know where price could rise and condense.
It needs to be known that these charts can also be used as stop-loss or take-profit levels in a much better way. If you are a day trader, the daily Pivot Point Trading Charts are the most appropriate one.
Some charting platforms allow the traders to plot them for other timeframes, such as weekly or monthly. Considering the performance accuracy, you can add a Pivot point trading chart to your trade toolkit to reap best trading options.
Lastly, it enables the trader to calculate the levels quickly to make quick decisions on price strategies. The accomplishment of a pivot point system depends fairly on the shoulders of the trader and their ability to effectively use Pivot Points Charts system in affiliation with other forms of technical analysis.
We wish you all the best and suggest you use this charting form for your short-term trades while staying cautious in your analysis.
If you wish to speak to an executive who can assist you with a trading account while providing you must more information on the usage of Pivot point trading charts – just fill in the form displayed below:
Summary
Reviewer
A Digital Blogger
Date
Broker Name
Pivot Points Charts
Overall Rating
