


Looking for Low Brokerage, High Margin & Free Tips?
Moving Average Envelopes
More On Technical Indicators
Moving Average Envelopes are popular technical indicators. In simpler terms, it is basically a percentage based envelope showing lines above and below the moving average of a stock price. The moving average of securities forms the foundation of this indicator and can be calculated by adding the closing price of a stock over a specified period.
For example, 10 days moving average calculation can be simply done by adding the closing price of the stock for the last 10 days and then just dividing the sum by the number of days i.e. 10 in this case. The moving average here can be simple as well as exponential in nature.
Having said that, the moving average method has been susceptible to providing false signals to traders in choppy markets. However, by adding an envelope to this method, it is possible to overcome the drawback and traders would be able to increase their profit. This indicator works best in trending market conditions in this detailed tutorial, we will try to understand how.
How Moving Average Envelope Works?
Moving Average Envelope (MAE) is generally used as an indicator for price trend, price breakouts and overbought or oversold conditions. For the calculation of moving average envelopes, we need to have an idea of the upper and lower band.
The upper band is a user-defined percentage (usually between 1- 10%) plus the moving average of the high prices. At the same time, the lower band is a user-defined percentage minus the moving average of the low prices. A buy signal happens when the price of the security closes above that of moving average and sell signal occurs when it falls below the lower band.
Moving Average Envelope is usually calculated based on a fixed percentage level kept above and below a moving average. Both the lower and upper bands are set using the same percentage level. The outer bands are used to recognize new trends.
However, it is important to note that the percentage used should be big enough to account for a maximum of normal price movement around Moving Average throughout the trendless period to minimize false signals, however, be small enough to recognize the start of a new trend.
The direction of the Moving Average ultimately regulates the course of the envelope. When the price of a security is rising, the moving average and envelope will move in a higher direction. When the price of a security is falling, they will move in the lower direction.
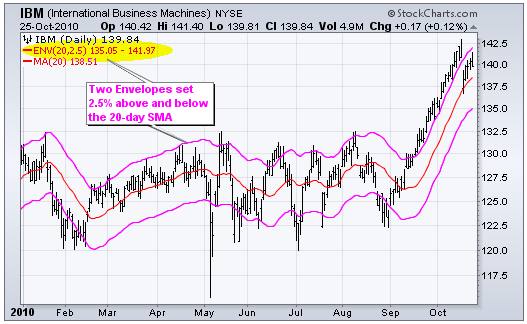
Given above is the Moving Average Envelope chart for IBM Company. The envelope is taken at 2.5% with a period of 20 days.
The primary fact behind Moving Average Envelope is that enthusiastic buyers and sellers will push the prices to maximum, i.e. the upper and the lower bands respectively. At this point, the prices would usually become stable and move to more realistic levels. When the price of securities touches the upper band and then goes downwards, we can say that the securities are presently at an overbought level.
Similarly, when the price of security touches the lower band and then goes upwards, we can say that security is presently at an oversold level. Anything excess over the upper envelope implies extraordinary strength whereas a drop below the lower envelope reflects unusual weakness.
These kinds of moves might indicate the completion of one trend and the beginning of another one. However, sometimes it may happen that a strong trend might not hold for a long time after breaking the envelope and there will be a movement of price into a trading range.
A comparatively flat moving range can identify these ranges, and the envelopes can be further used to recognize overbought and oversold levels for trading. When there is a movement above the upper envelope, it means there is an overbought situation, and when there is a drop below the lower envelope, it means an oversold condition is present.
Moving Average Envelope Example
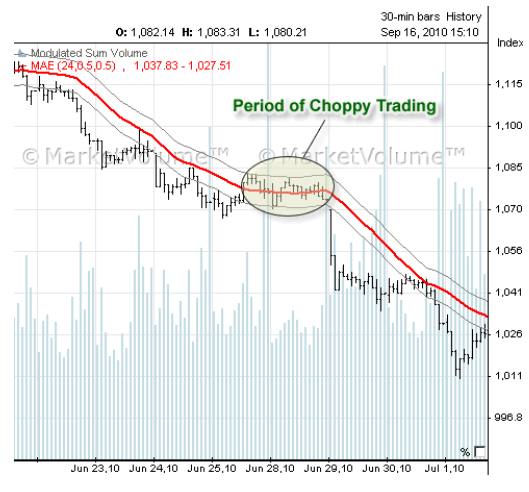
Given below is a classic example of moving average envelope in the S&P 500 Index.
As already mentioned above, Moving Average Envelopes can be used in choppy markets to avoid the occurrence of false signals. Hence, by adding the same to a simple moving average, the decision making gets simpler.
Traders are supposed to buy when the price increases above the upper envelope and sell when the price falls below the lower envelope. Any false signal is consequently filtered out. As we can see in the chart, as the price comes in the area of moving average envelope, it starts to move in the sideways direction.
The technical analysis needs to choose a comparatively high bar period for moving average and a moderately small shift percentage when it comes to the upper and the lower bands for divulging the sideways trend.
But when we select a more significant shift percentage and even smaller bar period for Moving Average, this envelope could be used to trace the overbought and the oversold levels. Thus in this case, as price moves close to or surpasses upper band, we can consider it is an overbought signal. And when price moves close to or falls below lower band, it is regarded as an oversold signal.
The goal of moving average and Moving Average Envelope is primarily to track trend changes.
Usually, these trends are big enough to equipoise the losses incurred by traders in the whipsaw trades (a condition where a security’s price quickly and suddenly changes its direction of movement due to volatile nature) which makes this a significant tool for those traders who are keen to receive a low percentage of profit.
When it comes to technical analysis, moving average envelope uses to track if price moves inside or swings outside the envelopes.
However, that’s not the only benefit of using moving average envelope.
Let us have a look at another weekly Moving Average Envelope trading chart for the company Starbucks with a moving average of 20 weeks and envelopes fixed at 20% above and below of it.
As we can see most of the times when the price of Starbucks touches the envelopes, trend reversal occurs. But there are also times when there is no reversal and prices continue to trend which further leads to losses. It is known as the countertrend strategy.
In a countertrend strategy, the method endeavours to generate small gains against the current trading trend. Under this method, traders try to buy shares when a stock’s price is low and sell it when it is high. The advocate of this strategy was Chester Keltner during the initial days when he introduced the concept of Keltner bands. A Keltner band can be considered as an improvement over moving average envelope.
Average True Range (ATR) has been used to set these bands above and below the exponential moving average. Instead of constructing a fixed percentage envelope, the width of the envelope can be in varied size. Traders buy the security when the price reaches the lower band and sell it when the price moves closer to the upper band.
Later the market witnessed the introduction of a new statistical chart named Bollinger Bands. These bands automatically adjust to the volatility factor. However, in the case of moving average envelopes, the chartist needs to adjust the volatility independently. Stocks which are highly volatile need wider bands and stocks which are no much volatile need narrower bands.
Moving Average Envelopes and Keltner channels and Bollinger channels are very similar and based on a similar concept; however, the latter two appears to be more dynamic because they take the volatility factor into account.
Moving Average Envelopes Advantages
Here are some of the top advantages of using Moving average envelope as a technical indicator in your trading analysis:
- Moving Average Envelope helps in identification of a new trend.
- It is exceptionally beneficial in trending market.
- It can be used to recognize overbought and oversold conditions.
- Helps the traders to earn profit from long-term trends.
Moving Average Envelopes Disadvantages
At the same time, here are a few concerns you must be aware of while using the Moving Average envelope:
- It does not take into account the volatility factor. Because of this reason, traders start to move from MAE to more volatility adjusted trading tools like the Keltner and the Bollinger Bands.
- It defers the entry on winning trades and provides more profit on losing trades.
In the end, we would like to re-iterate that the Moving Average Envelope is a vital trading tool that has been used by traders all over the world. Traders can use this method to identify new trends and also identify overbought and oversold conditions in markets which are range-bound.
Traders should use their experience and knowledge to find out what percentage should be used and what is the best period for calculating the moving average. It will depend on the market they are trading and their time frame.
Also one needs to select between simple or exponential moving average. That is going to depend upon the trader’s personal choice. Moving Average Envelope is highly efficient in trending market conditions but not so much when it comes to choppy markets.
Also, it doesn’t take the volatility factor into account.
We already know that any trading tool providing false signals can cause much damage and a massive loss to traders. For this reason, traders have recently started using the variation and highly improved version of Moving Average Envelopes, i.e. the Keltner and Bollinger Bands for more accurate and profitable results. Traders can benefit immensely by experimenting with these technical trading tools.
In case you are looking to start trading and investments, let us assist you in taking the next steps forward.
Summary
Reviewer
A Digital Blogger
Date
Broker Name
Moving Average Envelopes
Overall Rating
