


Looking for Low Brokerage, High Margin & Free Tips?
Intraday Trading Formula
| | Intraday Trading | No Comments
More on Intraday Trading
Do you know there are specific formulae for different kinds of trading formats? This is even applicable to intraday trading, for that matter. Yes, there is an Intraday Trading Formula that can help you to place your trades objectively based on numbers.
This detailed review is based on this particular topic. Let’s dig more!
As the name suggests, intraday trading means taking positions and exiting them on the same day before the closing of the market. This involves no change in ownership of the underlying securities.
In order to earn consistent profits from intraday trading, one needs to strategize and stick to the plans with the complete discipline even in the most volatile markets.
Also Read: Intraday Trading Strategies and Intraday Trading Mistakes
One of the most important things to remember is to stick to the pre-decided stop loss under all circumstances to protect oneself from a huge loss in intraday trading.
Intraday Trading Formula Using Advanced Volatility
Intraday trading for beginners can be risky and rewarding at the same time. What is important is to start smoothly and slowly.
So when it comes to beginning a trade, have you ever tried to learn intraday trading? For instance, do you know some of the basic terms – let’s say Volatility!
Volatility is defined as a variation of the price of a financial instrument over a period of time.
Advanced volatility formula is quite complex to derive but there are some free as well as paid advanced volatility calculators on the internet that generates buy and sell signals.
There may be slight differences in different calculators available and data points one needs to feed manually in order to get the buy and sell signals.
Some advanced volatility calculators will require data points like:
- Previous trading day’s closing price
- Current day’s high and low prices
- The volatility of the stocks or Nifty can be easily found out on the website of NSE.
By feeding this data, one gets the probable targets and stop loss. Using this intraday trading formula is fairly simple.
Intraday Trading Formula Using Pivot Points
Now, let us discuss an intraday trading formula that has a good probability of earning profits if followed properly. This is called the intraday trading formula using pivot points.
This is quite an effective intraday trading formula. Pivot Point is actually a technical indicator that is used in predicting the trend of the overall market. The trend can be predicted over different frames of time.
Also, it is best to know the Intraday Trading Time of your Stockbroker.
Let us see how to use it for day trading purposes.
For day trading, the formula determines the movement of prices of stocks on the basis of their movement the previous trading day. A Pivot point is calculated in the following manner:
Last trading day’s high = H
Last trading day’s low = L
Last trading day’s closing price = C
Pivot point (P) = (H + L + C) / 3
Now, as per this theory, if the current stock price is above the pivot point, there is a good probability of it reaching its resistance level. In some cases, the stock price can even reach the next resistance level.
Similarly, if a stock price is below the pivot point, it is assumed that it will continue to drift towards the first support level. It may further continue to go down till its next support level as well.
Calculation of resistance and support levels
The Resistance level is defined as a price level of a security or index above which the prices do not generally rise because at those levels, the bears become stronger than the bulls.
That means that the buying pressure becomes lesser than the selling pressures due to which it becomes a little difficult for the stock price to go up beyond the resistance levels.
The first resistance level (R1) is calculated by subtracting the last trading day’s low from twice the pivot point:
R1 = 2P – L
The second resistance level (R2) is calculated by adding a pivot point to the difference between the last trading day’s high and low prices.
R2 = P + (H – L)
The Support level is defined as a price level of a security or index below which the prices do not generally fall because, at those levels, the bulls become stronger than the bears.
That means that the buying pressure becomes greater than the selling pressures due to which it becomes a little difficult for the stock price to go further down beyond the support levels.
The first support level (S1) is calculated by subtracting the last trading day’s high price from twice the pivot point:
S1 = 2P – H
The second support level (S2) is calculated by subtracting the difference of last trading day’s high and low prices from the pivot point.
S2 = P – (H – L)
Let us understand this with the help of an example:
Calculation of pivot point and support and resistance levels for M&M on the basis of data of August 9, 2019.
Previous day’s high = 540
Previous day’s low = 516.65
Previous day’s closing price = 539.55
Pivot point (P) = (540 + 516.65 + 539.55) / 3 = 532.07
R1 = 2P – L = 547.49
R2 = P + (H – L) = 555.42
S1 = 2P – H = 524.14
S2 = P – (H – L) = 508.72
Also Read: Support & Resistance
Intraday Trading Formula Using RSI
RSI (Relative Strength Index) is a technical indicator that measures the changes in prices in order to determine whether the stock price is in oversold or overbought territory.
The basic assumption behind using RSI as buying and sell signals is that everything tends to normalise in the stock market. If a stock is in the overbought zone, it will come back to its normalcy after some time. The idea is to pick those stocks that have started moving towards their normal level.
In order to pick stocks that fulfil the criteria of RSI, one can use online screeners available for free on the internet.
RSI can be used for any time frame. It is commonly used on a 14-day timeframe.
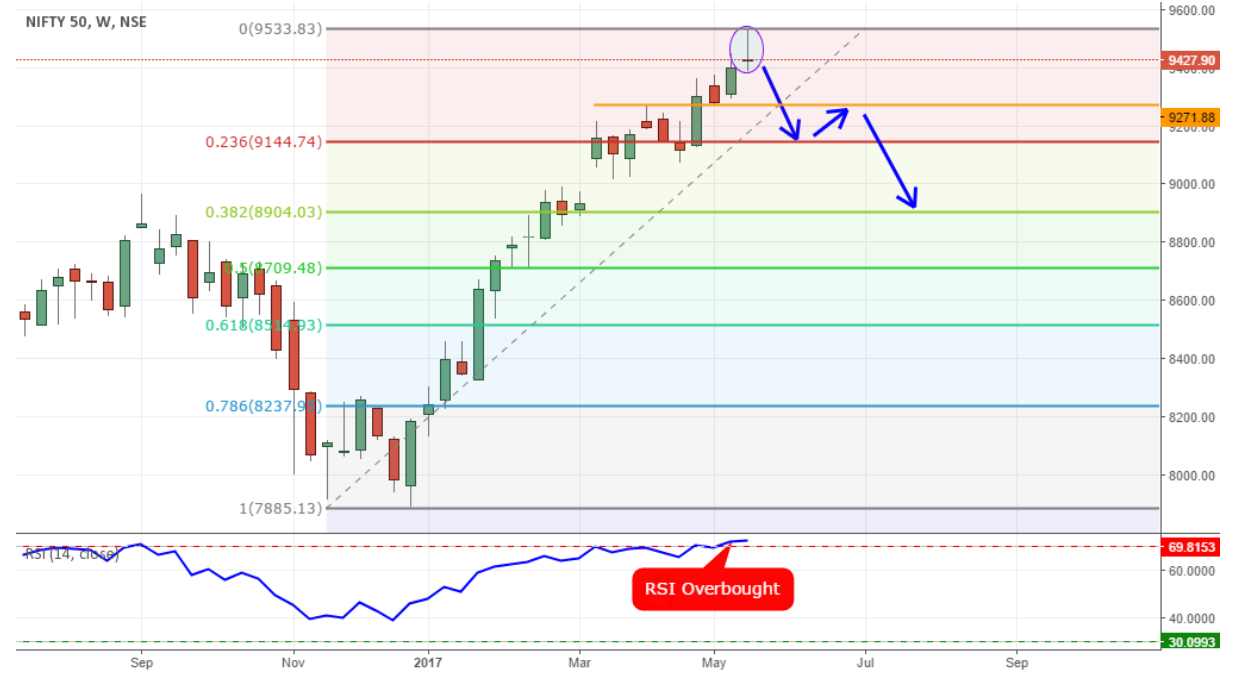
When RSI is above 80, it is considered to be in overbought territory. Some traders use RSI above 70 to call a stock or index price in the overbought zone. At this point of time, a trader should be alert about the potential reversal of the trend of the price movement.
After the price starts to move in the reverse direction and has touched a certain price level to give confirmation, one can take a short position and exit the position after taking a predefined profit.
Example: In the chart posted below, one can see NIFTY 50 touching the overbought zone. This is the sign where a trader can start thinking about selling it short as there is a high probability of it reversing its trend.
Similarly, when RSI is below 20, it is thought to be in oversold territory. Some traders consider RSI below 30 to call it in the oversold zone.
After a stock has stayed in this zone for some time, there is a good chance that it will start moving in the reverse direction at any time. Once the trend reversal is confirmed, a trader can take a long position.
Once the profits have come, one should exit the position and take a stop loss if the price trend fails to change.
Example – Let us see how RSI has been helpful in making a profitable trade in a stock names Jain Irrigation. After the stock has been below the RSI mark of 20, it has increased considerably in the next few days.
A long position taken at this point of time would have been extremely profitable for traders.
Breakout Method of Intraday Trading Formula
The breakout means the movement of stock price above the resistance level or below the support level.
Using this method in day trading means buying shares or taking a long position when the stock price breaks a resistance level. Similarly, an intraday trader sells first and takes a short position when the stock price moves below a support level.
The basic assumption behind doing so is that it is believed that the trend is going to continue.
How this intraday day trading formula is used?
For using the breakout method in day trading, we need to know about the resistance and support levels of each day. Also, besides the price movements above and below resistance and support levels respectively, one needs to take into account the volume numbers.
A false breakout is often seen when the stock price breaks the morning resistance level with very low volumes. Similar false breakouts can be witnessed when the stock price moves below the support level with low volumes.
Conclusion
If you are having a basic idea of what is intraday trading you can use the right formula and other parameters to understand the market trend and volatility. There is a lot of good content including many formulae that work in the stock market to a great extent.
One should take full advantage of this kind of education. Also, one should be careful while using them and maintain discipline with stop loss and targets.
You can be a pro trader by gaining a complete understanding of day trading with intraday trading example.
Be a wise, educated, and smart trader!
In case you are looking to get started with stock market investments or trading in general, let us assist you in taking the next steps ahead.
Just fill in a few basic details here:
Read More:
If you wish to learn more about Intraday Trading concepts, here are a few references for you:
Summary
Reviewer
A Digital Blogger
Date
Broker Name
Intraday Trading Formula
Overall Rating
