


Looking for Low Brokerage, High Margin & Free Tips?
Point And Figure Chart
| | Charts | No Comments
More on Charts
Point and Figure chart got popular in the 19th century when Charles Dow mentioned it in his editorial article of the Wall Street Journal. He called it the ‘Book Method.’
As a trader, you need to know different charting methods which will help to provide you with an edge over others. One of the popular charting methods we are going to discuss in this article is Point and Figure charts and how you can trade using it.
While constructing the point and figure charts, only the price aspect is taken into account instead of the time factor. By focusing just on the price, the method allows eliminating the daily market noise. It also helps in recognizing substantial support and resistance levels.
A support level is the price level at which the demand is assumed to become solid enough to stop price from reducing any further. A Resistance level is the price level at which sale considers to become robust enough to prevent the price from increasing further.
For more information, you can check this tutorial on Support and Resistance.
A series of Xs and Os variables are used to create the Point and Figure charts, which represents a fixed amount of price movement. The Xs reflect the rising prices, whereas the Os reflect the falling prices. There are two points which are important to note while studying this chart:
- Each column is either an X or an O. These two cannot be placed together in the same column.
- The X column and the O column always tend to be alternate with each other. We will never witness two X columns existing side by side, and this holds true for the O columns as well.
Point and Figures charts – How are they made?
While constructing traditional charts, we focus on the opening and closing price of the security. However, in the case of Point and Figure charts, the emphasis is given only to the closing price of the securities. As already mentioned above, there is only a price axis and no time axis.
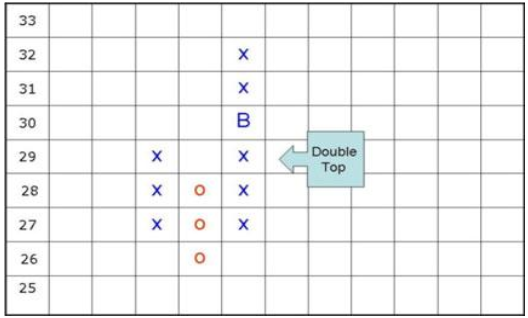
Given above is a basic example of a Point and Figure chart (P&F) in the bulls market. In the above case, the share price increased from 27c to 29c, which is indicated by the Xs. This is followed by a decline in price to 26c which is indicated by Os.
The Xs continues to be in the same column till the price continues increasing and don’t cross the predetermined reversal amount, after which a new column of Os appears. Each X signifies the increase in price by 1 box. The sensitivity of the Point and Figure chart can be altered by changing the box size.
Point and Figure Chart – Box Size
In this context, you may be curious to know about the box size. The Box size is basically the minimum price variation that must happen before the next mark added to a Point and Figure chart. The box size defines the value of price variations documented by each mark on the Point and Figure chart.
In futures contracts and stocks, the chart is used extensively for understanding the past and present price fluctuations by the technical analysts.
In Point and Figure charting, a new mark adds only after the price moves to a specific amount, whereas in traditional bar chart price changes registered at a daily chart or a five-minute chart, which means it will be documented in a specific time intervals.
Understanding Box Size:
A series of Xs and Os are used to plot prices in Point and Figure charts, which are known as the boxes. The mark X denotes the price increase, and O indicates the downward trend. Before a new box wants to print in the chart, the traders and investors must specify the size of the box to determine how much price change should occur.
It can be illustrated as follows:
If the specified box size is ₹10, then depending on the price movement, a new X or O will be documented each time when there is price fluctuation. If there is a rise in price, an additional X will be printed above each X when the price moves ₹10 point up.
Similarly when there is a drop in the price of ₹10 a new box of O will be printed on the right portion of the previous X mark. If the prices continue to drop at the rate of ₹10 or cross every ₹10, then the Os will mark below the previously marked O.
If you want a more detailed price movement, then the chart box size should be smaller. The larger the box size, lesser the information you will have on price movements.
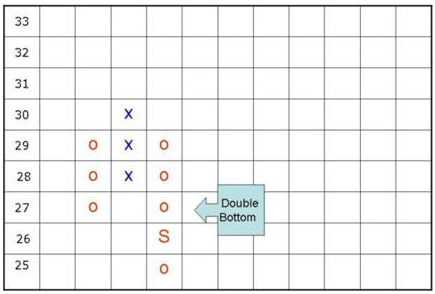
In the above figure, we have shown the Double bottom pattern formation. The S letter in the chart stands for the Sell signal. The above chart is a basic example of a bearish market. First, the price of the security drops to 27c and then an increase to 30c which is followed by a decline to 27c again.
It is important to note that the formation of a regular point and figure takes place in 3 columns or above. There can be no point and figure chart with less than 3 columns. The 3 box reversal method is, in fact, the most popular P&F charting method using by the traders.
Once you understand the basic formation of the chart, then you need to have some knowledge of other complex patterns. For example, the triple top “buy” signal takes place when a column of X’s surpasses 2 previous columns of X. To form this pattern, we need at least 5 columns. Check the below-given example for illustration.
There is also a triple bottom “sell” signal in which a column of falls below 2 previous columns of Os. The example of the same is given below:
Point and Figure Chart – How to determine box size?
Box size can be determined in the following ways:
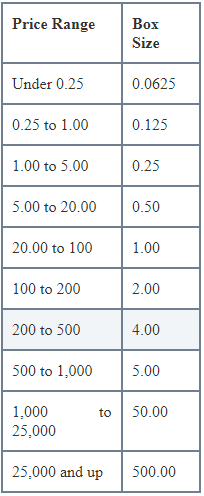
Traditional box scaling: Under this method, a predetermined table of price is using to decide the size of the box. Tom Dorsey popularized this method in his book, Point and Figure Charting.
Percentage scaling method: Box size is determined as a fixed percentage of the price of the security. For instance, a chart with 10% scaling and the stock price of ₹100 will have a box size of ₹10.
ATR scaling method: In this method, the box size is determined on the basis of the Average True Range (ATR) which is usually set at a default of 20 days.
Point and Figure Chart – Example
Two methods can be used to make the point and figure chart:
High/ Low method:
The high low method uses either of the high or the low range, not both. On a trading day, when the price starts rising, the upper range is considered, and on days when the price starts falling, the lower range is taken into account. This method is using to recognize the bullish and bearish sentiment.
High-low method is more reliable and accurate than the closing range method.
Following are the rules:
When it is an X column (rising):
- Use high if you can draw another X and you can ignore the low.
- Use the low when it is not possible to draw another X, and this triggers a reversal of 3 boxes.
- We need to ignore both when high doesn’t lead to another X, and the low doesn’t lead to 3 box reversal.
When it is an O column (falling):
- Use the low when we can draw another O and then high should be ignored.
- Use the high when it is not possible to draw another O and high leads to a 3 box reversal situation
- We need to ignore both when the low does not lead to another O and high does not lead to a 3 box reversal.
Above given is an example of point and figure chart using a High/Low range of monthly interval.
Closing range method:
As the name suggests, this method takes into account the latest price, and then that is compared to the preceding X or O which has plotted. If that confirms with the current direction, then the current direction should carry on. But if it does not, a new column is formed in the opposite direction.
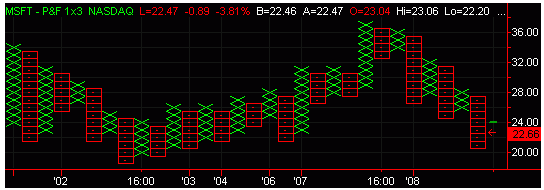
Given above are an example of a stock’s Point and Figure chart using the closing range method at a weekly interval.
Point and Figure Chart – Pros
Here are some of the positives or benefits of using these charts for your trade analysis:
- Removes any unimportant market noise and price movement.
- Support and resistance levels are easy to identify.
- The focus is on significant price movement.
- The chart is simple and easy to interpret.
- Since the point and figure chart ignores the time aspect, it is highly useful to interpret the volatile shares.
Point and Figure Chart – Cons
At the same time, here are a few problems you may face while using these charts:
- The box size should be selected correctly.
- The volume on which the change of price occurs is not taken into account.
Point and Figure Chart Conclusion:
The Point and Figure charts were popular in the 19th century when there were no computers. By using just newspaper information, pencil and graph papers, traders use to make and analyze over 50 charts every day.
However, after the introduction of computers in trading, people prefer to use other charting methods like bar and candlestick charts types.
Point and Figure charts have made a strong comeback recently because of its effectiveness as it does not depend on time and hence can eliminate insignificant market noise. These are a simple yet effective method of recognizing trends in market prices. When compared with other traditional market charts, point and figure chart provides a better picture of the market and help in quick decision making as well.
In case you are looking to start trading and investments, let us assist you in taking the next steps forward.
Summary
Reviewer
A Digital Blogger
Date
Broker Name
Point And Figure Chart
Overall Rating
