


Looking for Low Brokerage, High Margin & Free Tips?
Heikin Ashi Charts
| | Charts | No Comments
More on Charts
Heikin Ashi charts resemble something similar to candlestick charts. It is a type of trading chart originated in Japan. Heikin Ashi technique means ‘average bar’ in Japanese and they are in conjunction with candlestick charts to predict future trading prices.
The fact behind how to trade using Heikin Ashi charts gives an idea to keep traders in a trade where the trend exists but at the same time helps them to take an exit when the trend reverses.
In recent times, the major part of the business involves Forex trading and investment. On the Forex or stock market, we can earn or lose money if there is a hike or drop in prices. In the highly volatile stock/forex market Heikin Ashi chart usage helps to understand the price movement.
So what exactly are these Heikin Ashi charts?
Heikin-Ashi chart – How to Construct?
The Heikin Ashi charts can construct like a standard candlestick chart; however, the formula for calculating each bar differs. The time series can be defined by the user, depending on the required type of chart such as the frequency of daily, hourly or five-minute chart, etc.
The down days can be denoted by filled candles whereas the up days can be represented by empty candles. You colour the charts based on the platform. Up days are white or green and down days are red or black, at a general level.
This technique is used by technical or intraday traders to get to know the trend much better. The green candles appear with no lower shadows are used to indicate a strong uptrend, while filled red or black candles without upper shadow are used to identify a strong downtrend.
Heikin Ashi Charts – Trading Strategy:
As mentioned above, the term “Heikin Ashi” evolved from the Japanese term that means average bar. The indicator in Heikin Ashi gives an idea of how the price values are displayed. Before getting to know about Heikin Ashi, it is important to understand the basics of Japanese candlesticks.
This Japanese candlestick denotes four pieces of price data in visual forms, namely Open, Close, High, and Low.
It is highly useful as it allows us to see many pieces of information for each period plotted on the chart:
- The High trend you can see, is denoted by the candlestick’s upper shadow.
- The Low trend represents by the lower shadow.
- The body represents the ‘Open’ and ‘Close.’ If the ‘Close’ indication appears below the ‘Open,’ it shows a red candle, or if it appears above the Open, it shows a blue candle.
- Each candle provides clear pictures of the relationship between the ‘Open’ and ‘Close.’
The Heikin Ashi charts use modified candlesticks to sort out the problem. They are similar to conventional ones, but instead of using Open, Close, High and Low, they use average values for these price metrics. The Heikin Ashi formula helps to arrive the average values as follows:
- Open = (Open of the previous bar + Close of the precious bar)/2
- Close = (Open + High + Slow + Close)/4
- High = The maximum value from the High, Open or Close at the current time
- Low = The minimum value from the Low, Open or Close at the current time
Heikin Ashi candles are interconnected. The Close and Open price of each candle should be calculated using the previous candle Close and Open price and also High, and Low price of each candle gets impaired by the previous candle. The Heikin Ashi chart is relatively slow in comparison to a candlestick chart and it reflects delayed signals.
This type of trading strategy is popular among traders these days. It is also very easy to recognize as trader needs to wait for the daily candle to close. The previous candle doesn’t re-paint once new candle appears.
In the chart, you can find bullish candles marked in green and bearish candles marked in red. The strategy using Heikin Ashi will be very much influential in live trading and backtesting. Experienced traders would know that!
Heikin Ashi Charts – Why to Use?
If you look into the recent analysis, there are many technical analysis indicators and tools, but most of them are based on Open/Close/High/Low prices of the bars. Heikin Ashi is a great indicator that redraws the usual candlesticks by using Open/Close/High/Low from current and previous bars.
It definitely comes out as a powerful tool more specifically.
- Close is computed as the average of open, close, high and low of the current bar:
[Open (0) + Close (0) +High (0) +Low (0)]/4
- Open is calculated as the average of Heikin Ashi open and close of the previous bar
[(HA Open (1) + HA Close (1)]/2
- High is the maximum of the high of the current bar, the current Heikin Ashi open and the current Heikin Ashi close:
Close Max [High (0), HA Open (0), HA Close (0)]
- Low is the minimum of the low of the current bar, the current Heikin Ashi open and the current Heikin Ashi close:
Min [Low (0), HA Open (0), HA Close (0)]
Also, Heikin Ashi candlesticks are white when the Heikin Ashi Close is above the Heikin Ashi Open and red when the Heikin Ashi Close is below the Heikin Ashi Open.
Heikin Ashi Charts: Positives
Here are some of the benefits if you start using Heikin Ashi charts in your trades:
- When compared to the regular price chart, Heikin Ashi indicator reflects the slow down speed of the market, thus removing unwanted false signals.
- It makes many false signals and retracements disappear leaving you with solid calls taken into action.
- It indicates a strong trend allowing you to stay in the trade without being tensed or forcing you to take any unpleasant moves.
- Heikin Ashi charts help to measure the strength of the underlying move.
- Heikin Ashi candles denote the Open and Close prices leading to a smoothing effect on the price chart as well.
- Filters the noise around a trend.
- Heikin chart filters the shadows so that the chart becomes clear and easy to read.
- It is great for keeping you in an extended period of trade and visual simplicity.
- You can easily view where the core trend movement goes and where the counter-trend corrections taken place.
Heikin Ashi chart: Negatives
At the same time, here are a few concerns you must be aware of while putting Heikin Ashi Charts to work in your trades:
- The Heikin Ashi indicator doesn’t fit short-term and scalping rules or a Scalping strategy.
- Due to the smoothing effect of Heikin Ashi charts, the most popular candlestick patterns may be invisible.
Also read: How to do Scalping in Forex?
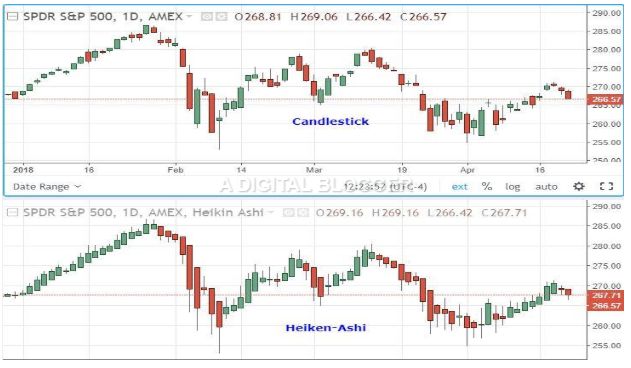
Standard Candlestick Charts Vs Heikin Ashi charts:
You can spot a few differences between these two types of charts. Heikin Ashi charts have a smoother look than the candlestick charts. The Heikin Ashi candles stay red during a downtrend and green during an uptrend whereas the standard candlestick seems to be of an alternate colour even if the price movement happens predominantly in one direction.
The price on standard candlestick will be the current price of the asset which matches with the closing price of the candlestick. Whereas, Heikin Ashi takes an average with the current price on candle not matching with the price in the market. It is the reason for showing two prices on Y-axis in charting platforms, one for the calculation of Heikin-Ashi and other for the current price of the asset.
Heikin Ashi charts – Best Usage:
These type of charts can be utilized anywhere in the market. The charting platforms with Heikin Ashi charts include the following five options as primary signals which identify the trends and buying prospects. They are:
- Green candles with no lower shadows show a strong uptrend, a ride with a profit.
- Hollow or green candles signify an uptrend, means you might want to add to your long position and quit your short positions.
- Candles with a small body surrounded by upper and lower shadows show a change in trend. If you are a person likes to take a risk, you may buy or sell here. Others may wait for confirmation.
- Filled or red candles shows a downtrend.
- Filled or red candles with no higher shadows validate a strong downtrend. You will have to wait for a short while till there is a change in trends.
Heikin Ashi charts Example:
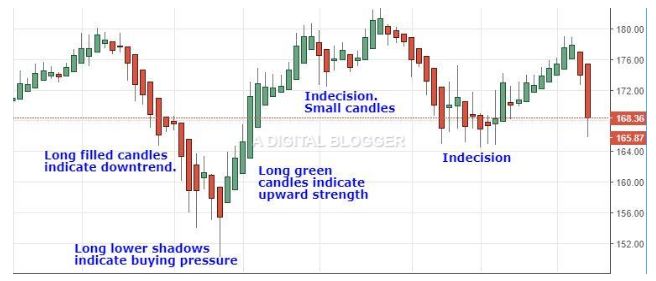
The example of Heikin Ashi chart given below can be used for analyzing and making decisions in trading.
On the left side, you can see the red candles, and at the starting point of the decline mark, the lower wicks you can find in a very small size. As the price keeps falling, the lower wicks tend to get longer, which indicates that the price dropped but again pushed back up.
The upward move is healthy and doesn’t give significant indications of a reversal, until there are many small candles in a row, with shadows on both sides. It shows the inability to take decisions on trade. It is the choice of traders whether they should select long or short candles.
The Heikin Ashi charts can also use to keep a trader in a trade once the trade commences. So you can stay in a trade until the candles change its colour. A change of colour in the candles doesn’t mean the end of the trend; it’s just a temporary halt.
Heikin Ashi charts Conclusion:
Traders embrace the trending concepts and show high enthusiasm to the Classic Technical Analysis and its reversal patterns with the touch of Japanese approach. The Classic Technical Analysis deals with trend indicators in Japanese approach.
Hence the Heikin Ashi charts are one of the most powerful indicators.
It is popular among the traders, not only for its simplicity but it gives excellent trades with marvellous risk-reward ratios. Thus trading on Heikin Ashi charts works similarly like other charts.
So trade by using Heikin Ashi charts to provide an entry point to find the stop-loss location and limit the risk and at the same time guide you to a profitable exit point. Hence these type of charts helps traders view trends and locate the potential reversals.
It is one of the best reversal trading strategy that offers a better way to manage trades.
In case you are looking to start trading and investments, let us assist you in taking the next steps forward.
Summary
Reviewer
A Digital Blogger
Date
Broker Name
Heikin Ashi Charts
Overall Rating
