


Looking for Low Brokerage, High Margin & Free Tips?
Best EMA for Intraday
More On Technical Indicators
Do you often rely on the EMA strategy for intraday trading? But are you using the right strategy for EMA? Are you aware of the best EMA for intraday trading?
If you are not getting a perfect result on using the EMA strategy then might be you are not using it correctly.
So, let’s learn how to use the exponential moving average and what is the best setting for the indicator for day trading.
Best EMA Strategy for Intraday Trading
Which are some of the best intraday trading indicators? The answer for this is known to all, but how to use it proficiently is the biggest challenge for traders especially beginners.
To ease things for you here is the best EMA strategy for intraday trading.
EMA being the lagging indicator tells you a lot about the market condition and trend. The indicator is used to determine the trend and further in making a decision for entry and exit points.
It gives more weightage to the recent data and is calculated using the closing price of the latest time period.
Now the time period!
What time period is the best for EMA?
In general, the EMA is set at 9 by default. This is good for the short term, but most intraday traders pick the value of 8 or 20 to get a better interpretation of price information and to make trade decisions.
Here the price trending above the moving average gives the bullish signal. On the other hand, the price trend below the EMA line creates an opportunity for short-selling.
Let’s see how EMA works?
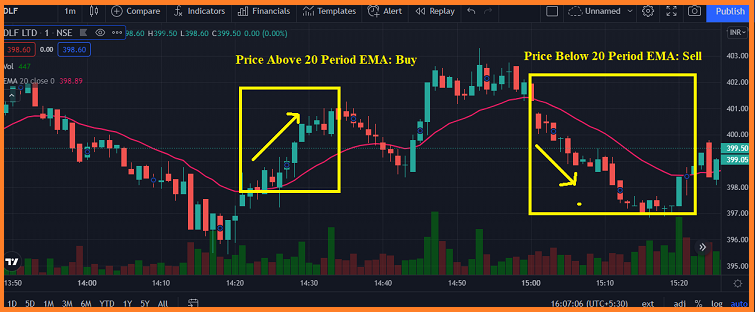
Here to cite an example, 20 days EMA is chosen to do an analysis of DLF stock.
When the moving average is below price then it gives the clear signal to ‘Buy’.
On the other hand, 20 period EMA above stock price gives the signal, that the is about to move to downwards and thus provides a ‘Sell’ signal.
For better sensitivity, you can pick the fast-moving average of less time period, 8 or less for intraday trading.
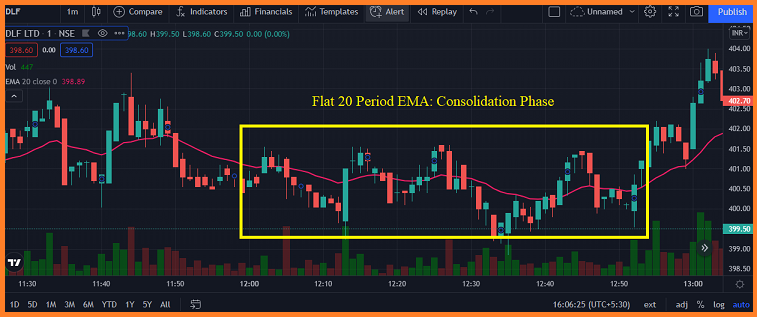
But does this indicator gives you the signal for the consolidation phase?
For this check another image below:
When the EMA 20 is flat, then it gives a clear indication of the consolidated phase, and hence it is better not to take any kind of decision at this point in time.
Again to reap the benefit or for better analysis, it is good to determine the crossovers and further to use the best combination of technical indicators for intraday trading.
Best EMA Crossover Strategy Intraday
Now comes the crossover of the EMA. As discussed above, EMA helps in determining the bullish or bearish trends and also gives the information of the consolidated market.
But further the combination of EMA and their crossover, help traders to analyze the market and in making a trade decision.
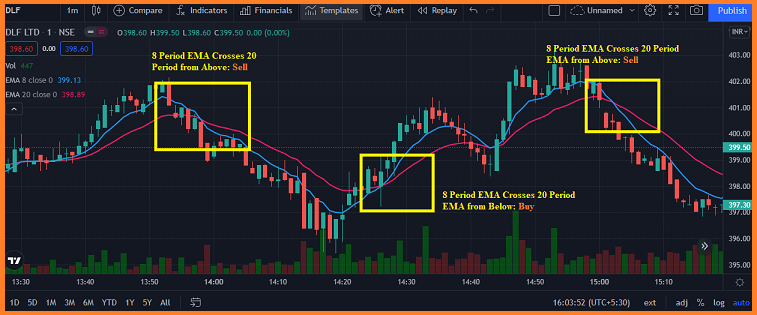
To understand this, let’s have a look at the image below:
In the image, we have used the combination of fast EMA (8-period blue line) and slow EMA (20-period red line).
The concept remains the same.
When the fast-moving average crosses the slow-moving average from above it gives the bearish signal and hence the trader can make a shorting decision.
On the other hand, the fast-moving average when crosses from below, the trader can go long as it gives the clear sign of the upward trend.
Best EMA Setting for Day Trading
We talked about the EMA crossover and combinations, but here comes the challenge for the beginners, how to set ema on the charts.
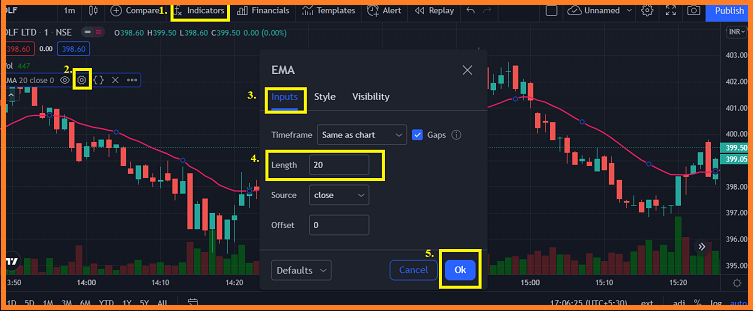
Here are the steps involved in the setting EMA for intraday trading strategy:
- Click on Indicator and select Moving Average Exponential.
- Click on the ‘Setting’ option.
- Tap on the ‘Input’ button.
- Click on Length to define the period for which you want to analyze the trend.
- Click on the ‘OK’ button.
The EMA line will be displayed on the screen that you can use to analyze the stock trend and to make the buying and selling decisions in intraday trading.
Conclusion
EMA no doubt, is the simplest indicator that helps in doing technical analysis of a stock. But there are some fallasies associated in using the indicator. Some of them are:
- Since it is the lagging indicator it moves slower than the trend.
- It is unable to predict the future trend of the market.
So, make sure you use a combination of technical indicators and follow the right strategy to reap the best benefit out of your trade.
Start investing now by opening a Demat account with the renowned stockbroker in India.
More on Intraday Trading