


Looking for Low Brokerage, High Margin & Free Tips?
Ichimoku Cloud
More On Technical Indicators
Like any other trading, currency trading also has a substantial risk of loss, but the usage of some strategies may reduce the threat of such losses. Ichimoku Cloud is one such Japanese charting method that helps to identify the probable direction of the price and helps a trader to determine the most suitable time to enter and exit the market.
Though the name implies cloud, Ichimoku Cloud is an indicator that provides information about resistance, support, momentum, and trend direction.
It is a standalone trading system with an all-in-one set of indicators. Ichimoku Kinko Hyo, the full name of the Ichimoku cloud indicator translates to ‘one look equilibrium chart‘ which holds the essence of its functionality.
Developed by Ichimoku Kinko Hyo, this technical indicator or an analysis method took over 30 years to shape up the way how we use it today for improving the forecast accuracy of price moves.
Ichimoku Cloud Definition
At very first glance, you will find the Ichimoku Cloud a bit challenging to understand. In this, you can see the cloud formation by two averages, and there will be a total of five such moving averages. The chart considerations can be set as per the choice of the traders; however, it uses 9, 26, and 52 days as default parameters.
It also provides some trend signals which allow you to predict upcoming trends of the price.
Traders who have no technical knowledge about the indicator may find it is difficult to understand the chart. Though it might be confusing, a deep understanding of the techniques will certainly help you to grasp the chart readings.
In this detailed article, we want to improve the understanding of traders about Ichimoku Cloud and make you accustomed to its settings and learn the trading strategy which you can easily apply to your trading toolkit.
Ichimoku Cloud Strategies
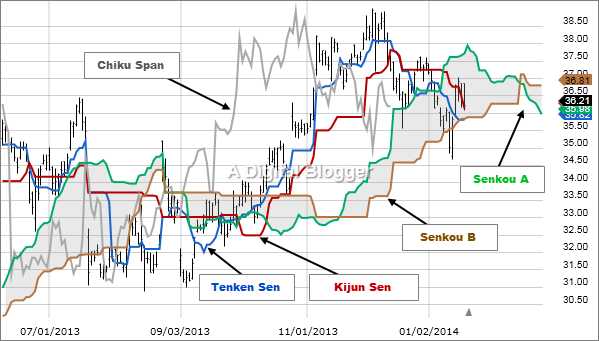
Before you want to explore the possibility of using Ichimoku Cloud, you should take a closer look at various inputs, so that you can have a better understanding of it. The chart is a combination of five lines, out of which there is one line each of red, blue, green colors and two lines of orange. The orange line will have a gradient or shade in between.
Each line represents the moving average, and these lines have their own purpose. Ichimoku Cloud will let you understand the moving averages, even if you have no idea about technical indicators.
Let’s try to understand what each color-coded line implies for a trader:
- Red line (Tenkan Sen) – In this, continuous reading of the last 9 days’ high and low points are used to chart the moving average for the time duration.
- Blue line (Kijun Sen) – It is another moving average function that is similar to the Tenkan Sen (red line), but it uses 26 days average instead of 9 days. The Kijun Sen moves much slower than Tenkan Sen because it uses more days (periods). The reaction display will be less since it uses more periods than short periods.
- Green line (Chikou Span) – This moving average represents the current price in the market. But in this, you have to take the current price and move back to 26 days. If the trend of the past 26 days shows an upward movement, then it is a bullish trend, and if it shows a downward movement, then it is a bearish trend.
- Orange lines (Senkou Span) – It appears in two orange lines and in between the shaded portion, which is the popular ‘cloud’ section.
The first orange line will be above the second orange line during the market uptrend. The creation of the Senkou span is easy to understand. It is a compilation of two moving averages. The first orange line represents the current average reading of the highest and lowest Tenkan Sen and Kijun Sen by charting 26 days to the right.
If the second orange line exhibits the most top mark in the chart, it is an indication of an alarming downward trend. It uses a charting technique based on 52 days of highest and lowest points of the trade.
The cloud portion is the Senkou Span, which forms due to the interactions of two averages as mentioned above, which indicates the maximum support or resistance level for best trading practice.
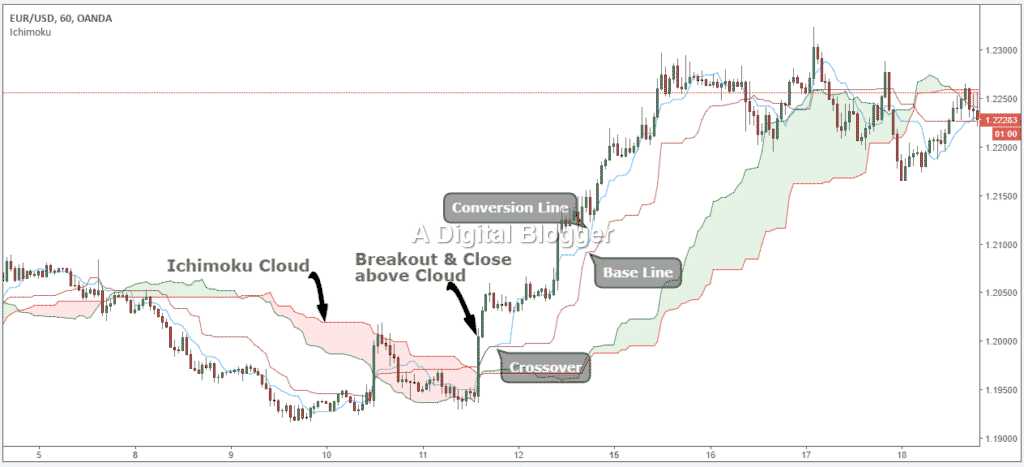
Ichimoku Cloud – How to Use Guide
Now you have a basic idea about the moving averages. Let’s discuss an Ichimoku trading system that doesn’t require or use any additional indicators on the chart, and it applies to all trading instruments and time frames.
Strategize your trade:
When the price breaks through the cloud and closes outside, you can adopt trading strategies. When you see this trade trigger breakout, start your trade towards the breakout direction and keep the position, until the security breaks the Kijun Sen on a closing basis.
Trade strength and weakness
When Senkou Span moves up and drifts away from the blue line, it is an indication of an uptrend. When the Senkou span moves down away from the blue line, it means the downtrend is accelerating. In short, the thickening cloud helps to confirm the current trend.
A very thin cloud indicates indecision and a potential weak trend. Stay cautious here!
The cloud projects at 26 price bars to the right of the current price facilitating an idea about where resistance and support may develop in the future.
During an uptrend, the price often bounces off the cloud during pullback (pullback meaning) and then resumes towards the uptrend. At the same time, when a downtrend is in order, the price retraces to the cloud and continues to the lower side of the market. Here, the cloud showcases entry opportunities into the trend.
So, keep your eyes open when this is about to happen.
This is the real market opportunity time for a trader like you eyeing profits!
Crossover signals
If the price reflects above the cloud and the orange line appears above the blue line, the trend is up. Meanwhile, if the conversion line falls below the baseline and then rallies back above it, it depicts a long entry.
If the trend is down, it implies that the price is below the cloud and the orange line is below the blue line. At the same time, the conversion line is above the baseline and drops back below it, then it shows a short entry.
Ichimoku cloud – Ways to Use
Many traders chose to focus on the cloud, but let’s take a look at 2 different ways to use it for Forex trading (or currency trading in India).
The first way is to check when both Senkou lines cross each other. The cross represents a powerful signal, and many traders use it as a sign of trend reversal. The same chart displays trends that start or end when the cloud changes its color.
Keep in mind that when checking the historical price, the time when the cloud turns correct to a price level 26 periods ahead.
A different way to use the cloud is to trade support and the resistance level offered by it. Understanding the cloud value projected in time, traders wait for the real price to reach the cloud before going short or long.
The best way to trade the strategy is to wait for a trend to begin and run for some time. As the market stabilizes, and on the first cloud test, trade of either short or long starts happening depending on the nature of the trend.
In some instances, the 2nd and 3rd tests are good enough for a trade. But, that happens only in the case of strong trends, when the first test often works, traders use the right risk-reward ratio.
Ichimoku Cloud Cons
Like any other indicator, Ichimoku Cloud only gives information on analyzed time periods (though the cloud shows a projection to the future as well).
There is a more significant trend that the Ichimoku cloud doesn’t account for and the chances of false trade signals generated also holds correct. For instance, the prominent trend may be down, but the price might go above the cloud on a retracement only to fall within the downtrend sometime later.
The Ichimoku Cloud is also a set of moving averages that may or may not offer resistance in a downtrend or support during an uptrend. All the calculations depend on history that means trade signals can appear late or at an odd time as short-term historical tendencies may not repeat in the future.
Even though it provides entry signals at times, traders must determine where to take profits and figure out how to control risk on each trade.
Ichimoku Cloud Conclusion
The Ichimoku Cloud is quite a helpful indicator, especially for the new traders who want some help in gauging the trend direction, finding entry points, spot trend reversals, and momentum.
However, traders will have to control risk with a stop loss and must find a way to exit trades successfully. Once broken down, every trader will find Ichimoku Cloud beneficial.
The indicator chart integrates 3 indicators into one and provides a filtered approach to the price action for traders. Additionally, this approach increases the probability of trade in the currency market and also assists in isolating the correct momentum.
With all the lines represented in different colors, the Ichimoku Cloud can look complicated, but basically, the idea is if the price is below the cloud, the trend is down. Look for short positions and avoid long positions. When the price reflects above the cloud, the trend is up. When the trend is up, avoid long positions and avid short ones.
Ichimoku Cloud system can offer the best information for spotting trends and generate profit from trading. If you can effectively use the rules of Ichimoku Cloud, you might be able to capture a sufficient amount of the trend. If the price reflects above the cloud, then the trend is up.
Therefore, target long positions and bypass a short position.
In case you are thinking of getting started with stock market investments or trading, let us assist you in taking the next steps forward:
Summary
Reviewer
A Digital Blogger
Date
Broker Name
Ichimoku Cloud
Overall Rating
