


Looking for Low Brokerage, High Margin & Free Tips?
ZigZag Indicator
More On Technical Indicators
The price trend is the predominant factor in stock/forex trading. It is not the absolute measure of success, but such trends will give an insight into when to enter and exit the market. So, when you need to study the price trends with technical accuracy, you can use ZigZag Indicator and the corresponding charts, as it is one of the proven price level indicators.
You can find many trend charts in the market, out of which the ZigZag Indicator is a friendly tool that helps to study the price trends. These charts help to remove random fluctuations in price and tries to exhibit trend changes.
The ZigZag lines are only visible when there is a movement of the price higher than a specific percentage between swings of high and low, which is generally 5%.
For instance, a ZigZag set at 5% would ignore all movements of price less than 5%. It is not an actual indicator but a method to filter out small and insignificant price movements.
ZigZag Indicator Basics
The ZigZag indicator basically puts the focus on significant trends by removing the smaller ones that do not provide much of an impact on the trader. Both points, as well as percentages, are used in making a ZigZag indicator. For the construction of the ZigZag indicator, there must exist a specific number of points or percentages between the swings of highs and low.
Now let us find the intricacies of the swing high and low.
Swing high – When the price (generally the closing price) is higher than the price before it, as well as after it.
Swing low – When the price (generally the closing price) is lower than the price before it, as well as after it. In technical analysis terms, Swing low refers to the troughs point of an indicator or a security’s price. Troughs indicate the end of declining business activity. In the Swing low point, the position will be lower than any low prices around the low price at the time of closing.
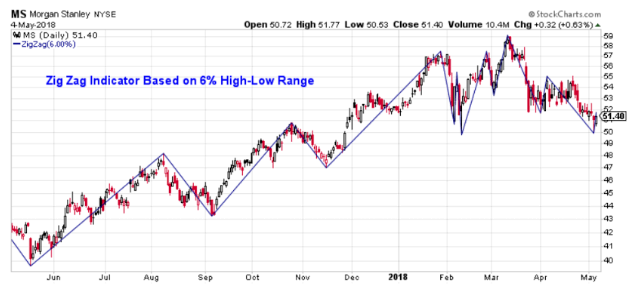
Given above is an example of a ZigZag chart based on a high – low chart at 6%. Therefore the price movement which is less than 6% does not produce a trend on the chart. So a trader will see only 6% and more significant changes in price and will be able to snub the myriad movements that do not impact the overall price trend.
A set of percentage points must also be fixed for creating the ZigZag chart. Even though the default value for this is 5%, if you set the same to 9%, it would make sure that movement of the price which is 9% or higher than that only be exhibited in the chart.
It would ensure to remove smaller price swings and helps the trader to concentrate on the larger picture. Usually, stock’s closing price is a detrimental factor using for the purpose, and fictional points are put on the chart to determine where the price reversal happens with a permanent value in percentages.
The results of the ZigZag Indicator Strategy shall depend on the type of chart.
The closing price will be used to create a line and dot chart, so naturally ZigZag will show the chart based on closing prices.
The chart reading will display as per the percentage value fed on the ZigZag indicator. Line and dot charts will show closing price based ZigZag whereas high-low bars will show high-low range based ZigZag. The ZigZag based on the high low range will tend to change the path more likely than the one based on closing price as the high-low range creates greater swings.
The ZigZag Indicator is an excellent indicator helping traders to make maximum profit by focusing on larger price movements and restrict traders to waste their time on insignificant price changes, which is a common trend in the securities market.
A trader will have the liberty to change the percentage value, which will accordingly modify the ZigZag signal. In the above chart, the set percentage value was 6% of high-low fluctuations.
ZigZag Indicator Strategy
The candlestick charts, bar charts of High-Low-Close and Open-High-Low-Close will show the ZigZag based on this high-low range. Because of this, all these points will reflect the high-low price range. A ZigZag based on close will have less chance to change direction than the ZigZag based on high-low range.
So it is apparent that the ZigZag based on high-low will have more possibility to change course because the range will be much wider than close and a result, you can expect more significant swings.
The purpose of the ZigZag Indicator Strategy is to help the traders with remaining in a winning situation and prevent the impulse to close positions based on the insignificant reactions, which are prevalent in the market. Traders can fix the percentage move which will create a change in the ZigZag signal (in the above chart, which is 6%).
That is why the usage of the best indicators in positional trading becomes very crucial.
Even though initially ZigZag chart might appear to be the most significant and profitable trading tool, one must remember that the values of this indicator are used to plot after the closure of the price. Thus, you should make use of this chart to observe the condition of the primary trend, and not an instrument for trading in the market actively.
The ZigZag Indicators results are very promising, and its projections help a trader to be in a better winning position. But, one thing you should always remember is that the values required for the plotting are taken only after closing the price.
Since the graph projected depends on the past data, you cannot use this indicator for active market trading, but you can use this reading to estimate the future trend of the market.
Also Read: Best Indicators for Day Trading Futures in detail.
ZigZag Indicator Example
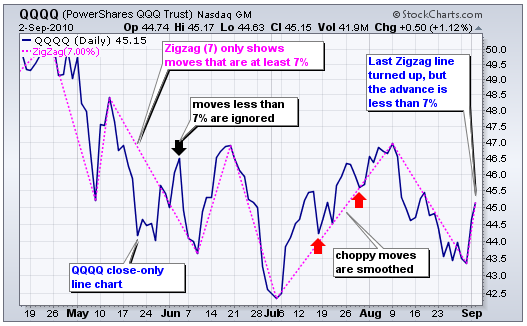
Given above is a QQQQ ZigZag chart for 7%.
As we can clearly see, the bounce in early June had floated as it was lower than the set 7%. The black arrow in the chart indicates the bouncing movements. Similarly, in July, two pullbacks also found floated as they were much lower than 7%.
It is exciting to observe the complex nature and movements of last ZigZag line. It’s less than 7% still it is shown up. It happened because it is a temporary line which is yet to touch the threshold.
The price movement should be to 46.40 to reach 7% after which a permanent ZigZag line will be made. When the line could not reach the edge of 7% mark, then the provisional line will disappear, and it will be replaced by the previous ZigZag line and continue to reflect as the current indicator.
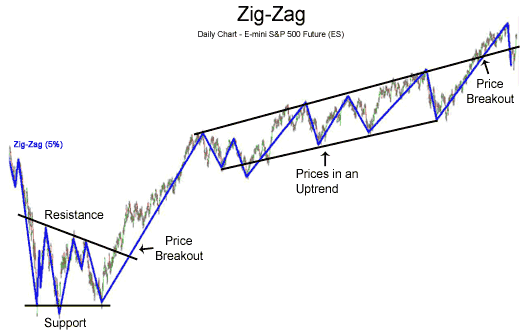
The ZigZag Indicator Strategy can be useful in removing short-term noise and detecting important trends and changes in the price of the market. Given below image will help us to understand how ZigZag helps in finding the price breakout and support and resistance levels.
Traders also use this chart with retracements feature to recognize Fibonacci predictions and retracements.
Above is an S&P ZigZag chart of 5%. In this, you can find only price movements equal to or more than 5% as we can see on the left side of the chart, a formation of a triangle consolidation. Now it is imperative to understand what is a triangle consolidation pattern and how does it help the traders?
Generally, when there is a significant price movement, and followed by the price movement there will be a period of resting. The triangle pattern comprises of lower lows and higher lows, creating the shape of a triangle.
Hence when the support and resistance lines meet, the price comes out of the consolidation area, and it will force us to assume that this action of the price will continue to trend in the path price that had been making a movement prior.
Buy signal occurs when there is penetration of resistance line to the upside.
Sell signal occurs when there is penetration of the support line to the downside.
The ZigZag chart can also be helpful in identifying the reversal of trends like the head and shoulders pattern (double top pattern or double bottom pattern). It is a handy technical indicator.
Traders generally make use of other technical indicators like the Stochastic Oscillator (OS) and the Relative Strength Index (RSI) to make sure that the price of a stock is overbought or oversold when there is a change in the direction of ZigZag.
ZigZag Charts are often using in conjecture with the Elliott Wave. Elliott wave theory implies that in the market, similar kinds of patterns are possible to form on a smaller timeframe as well as the longer timeframe and these patterns could be studied to know what is going to happen next in the market.
To be precise, irrespective of the time frame, the same pattern is going to be formed by the market.
Given above is an S&P ZigZag chart at 6%. Based on this pattern, a complete cycle has formed from March 09 to July 10 which comprises 5 upward waves and 3 downward waves. However this 6% is not set a percentage level.
Traders need to experiment with different percentage level to identify the one which gives the best result. For instance, it might be possible for some traders that a setting of 5% provides them with more positive waves instead of 6%.
Each stock has its own unique trading pattern, and so one must not rely on what others are using. Identifying the right ZigZag indicator will help to decide the placing of each Elliott Wave in the complete cycle.
ZigZag Indicator Advantages
- By eliminating the minor and insignificant movement of price, ZigZag Indicator Strategy helps traders to identify trends quickly.
- Helps in easily detecting the support and the resistance lines.
- Eliminates unnecessary market noise.
- ZigZag indicators help traders to recognize the market trends.
- It can use with other technical indicators for effective results.
ZigZag Indicator Drawbacks
- ZigZag follows the trend, and hence the result depends on past data which means, there is no change in its direction until the occurrence of a price movement.
- Many of the recent ZigZag lines are temporary, and when there is a change in the direction of price, the ZigZag also starts to draw a new one. When the price doesn’t reach the threshold percentage, that line gets eliminated and replaced by an extended line in the original direction of the trend. This is not useful for deciding the timing of entry and exit in the market.
Thus while using this chart, don’t forget to determine if the last line is permanent or temporary. You can quickly identify it.
If the current movement of price is lower than the ZigZag indicator, then the line is temporary, and if the movement of price is higher or equal to a ZigZag indicator, then the line is permanent.
ZigZag Indicator Conclusion:
ZigZag Indicator is a fundamental and traditional strategy that helps to eliminate unnecessary noise of the stock market. It can perform very basic tasks if combined with other technical indicators, and it can turn out to be immensely helpful. It is important to note that ZigZag can’t be used for price forecasting purpose as it depends on past data.
If you want to use it for share market prediction purpose, you need to combine it with other technical indicators such as Price Pattern Analysis or Elliott Waves.
In case you are looking to get started with stock market trading, let us assist you in taking things forward:
Summary
Reviewer
A Digital Blogger
Date
Broker Name
ZigZag Indicator
Overall Rating
