


Looking for Low Brokerage, High Margin & Free Tips?
Intraday Trading Charts
| | Charts, Intraday Trading | No Comments
More on Intraday Trading
Intraday trading is a challenging domain. It involves buying and selling of securities on the same day, during the exchange trading hours.
However, various intraday trading tools are available to help the intraday traders make an informed and profitable decision.
Using the right trading tools is critical to the success of a day trader. One of the most important trading tools is the intraday trading charts.
Intraday Trading Charts are an effective way to understand the market movement and for intraday technical analysis to predict the price movements.
They give detailed information about the opening, closing, high and low of the security trade in the defined time interval.
The charts can be adjusted to show the particular time frame that the trader wants to be invested in- hourly, 15 minutes, 5 minutes, daily or any duration thereof.
The ability is read the charts efficiently is a very important skill for a day trader to earn profits and be successful.
It takes a lot of practice to become skilled at it.
Intraday Trading Charts Types
Intraday Trading charts provide data which is a combination of price, volume and time intervals. The charts can be of different time frames, for instance, 1-minute charts, 15-minute charts, hourly, weekly or monthly charts.
The chart of a particular time frame shows the price movement in that specific time frame.
Similarly, in the transactions specific charts, a new bar is formed once the specified number of transactions have occurred and in volume specific Intraday trading charts, a new bar is formed once a set amount of volume has occurred.
The Intraday trading charts can mostly be classified on the basis of how the specific information is displayed.
On this basis, the top 7 intraday trading charts are as follows:
Line Charts:
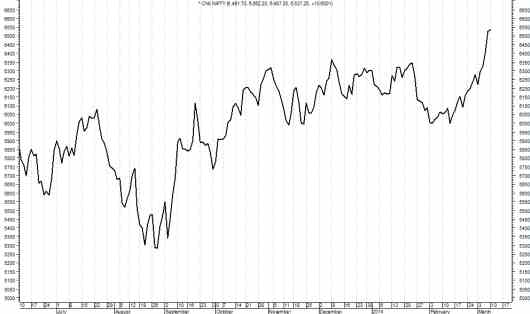
Line Charts are one of the simplest trading charts with a time base as each data point on the chart is from a fixed time period. Line charts are simply formed by joining the closing price of the security in each time period and forming a line.
They are very significant in observing the long-term trends and observing chart patterns such as heads and shoulders pattern without much surrounding noise. However, for active day traders, line charts may be far too simple as they do not provide much precise information about the intraday price movements.
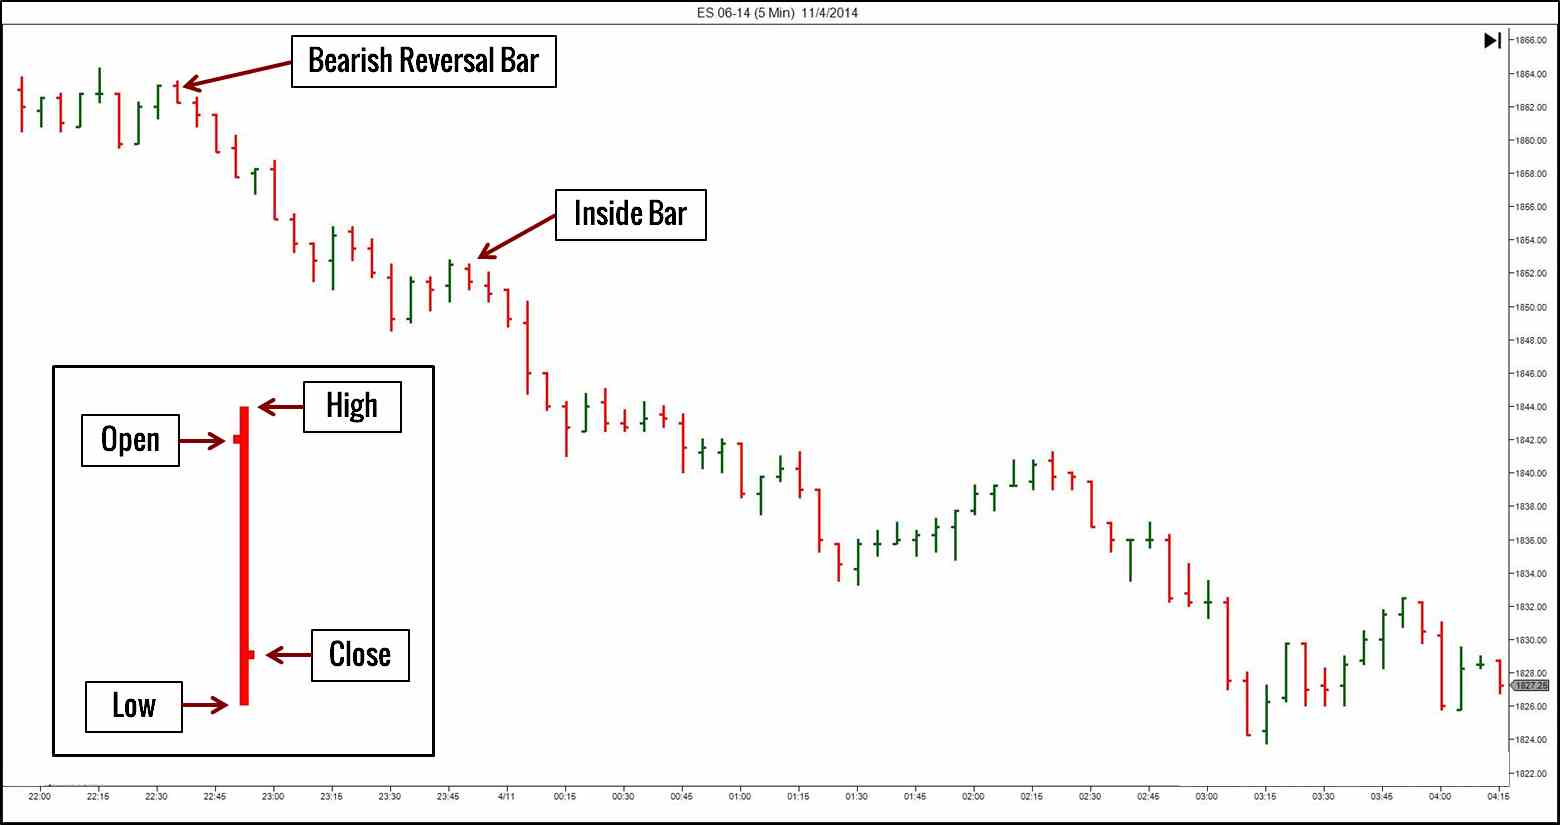
Bar Charts:
Bar Charts are also one of the time-based Intraday trading charts. For each time period, they use the opening price, closing price, highest price and lowest price to build a price bar for the specific time period. Therefore, they are also known as the OHLC charts.
Each bar is made up of a vertical line joining the highest and lowest prices, with a short horizontal line extending left at the opening price and a short horizontal line extending right at the closing price.
They may also be coloured green or red to indicate the net gain or net loss in intraday trading at the closing price. Bar trading charts mostly depict emotions like fear due to panic selling.
Therefore, bar charts are the time charts that help the traders to time their entries with controlled risks, although they lack visual appeal and are not able to identify patterns very easily, so they are not used very commonly.
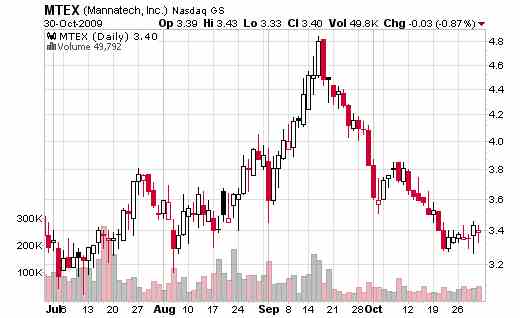
Candlestick Charts:
Candlestick trading charts are quite similar to the bar charts being time-based and indicating opening, closing, highest and lowest prices for a specific time period; however, there is an enlarged region between the opening and closing price which forms the body of the candlestick.
These Intraday trading charts are the most standard type of time-based charts used in intraday trading.
As per the analysis of candlestick chart, it consists of a body, upper tail and lower tail (wick), and the body may be coloured red or green indicating a net price drop or net price rise of the closing price.
When closing price is more than the opening price, a bullish candle is formed and when the opening price is more than the closing price, a bearish candle is formed.
Intraday traders look for specific pattern formations in candlesticks as their trade signals.
They provide more information than the line charts but also occupy more space than the bar charts hence decreasing the information that can be displayed for a time period.
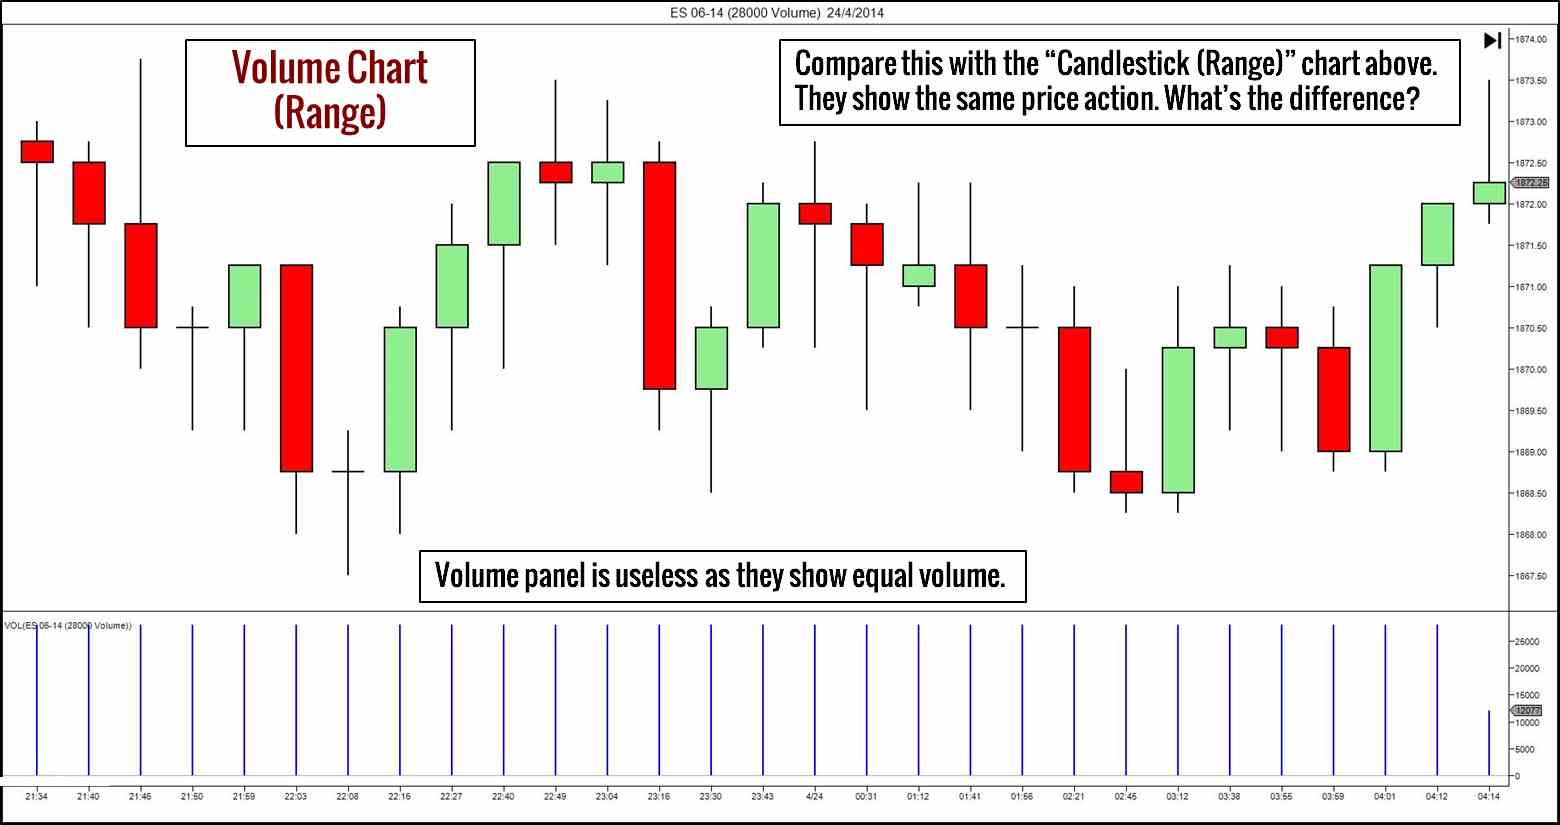
Volume Charts:
Volume charts are the Intraday trading charts that use level of market activity as their base, instead of time. Time-based charts pose a problem when there are times in the market with no activity; at these times time-based charts may end up giving an inflated picture of the market activity.
Volume trading charts depict volume, which is the number of contracts or shares traded in the market. Instead of taking OHLC data for a specific time frame, the data is taken for a volume block. Thus, the volume of the market gets represented as bars or candlesticks and each bar or candlestick represents a fixed volume.
Using a volume chart, when the market is slow, the chart slows down too and presents less sideways movement. However, volume charts cannot be used to confirm if a break-out is valid, or for volume-spread analysis.
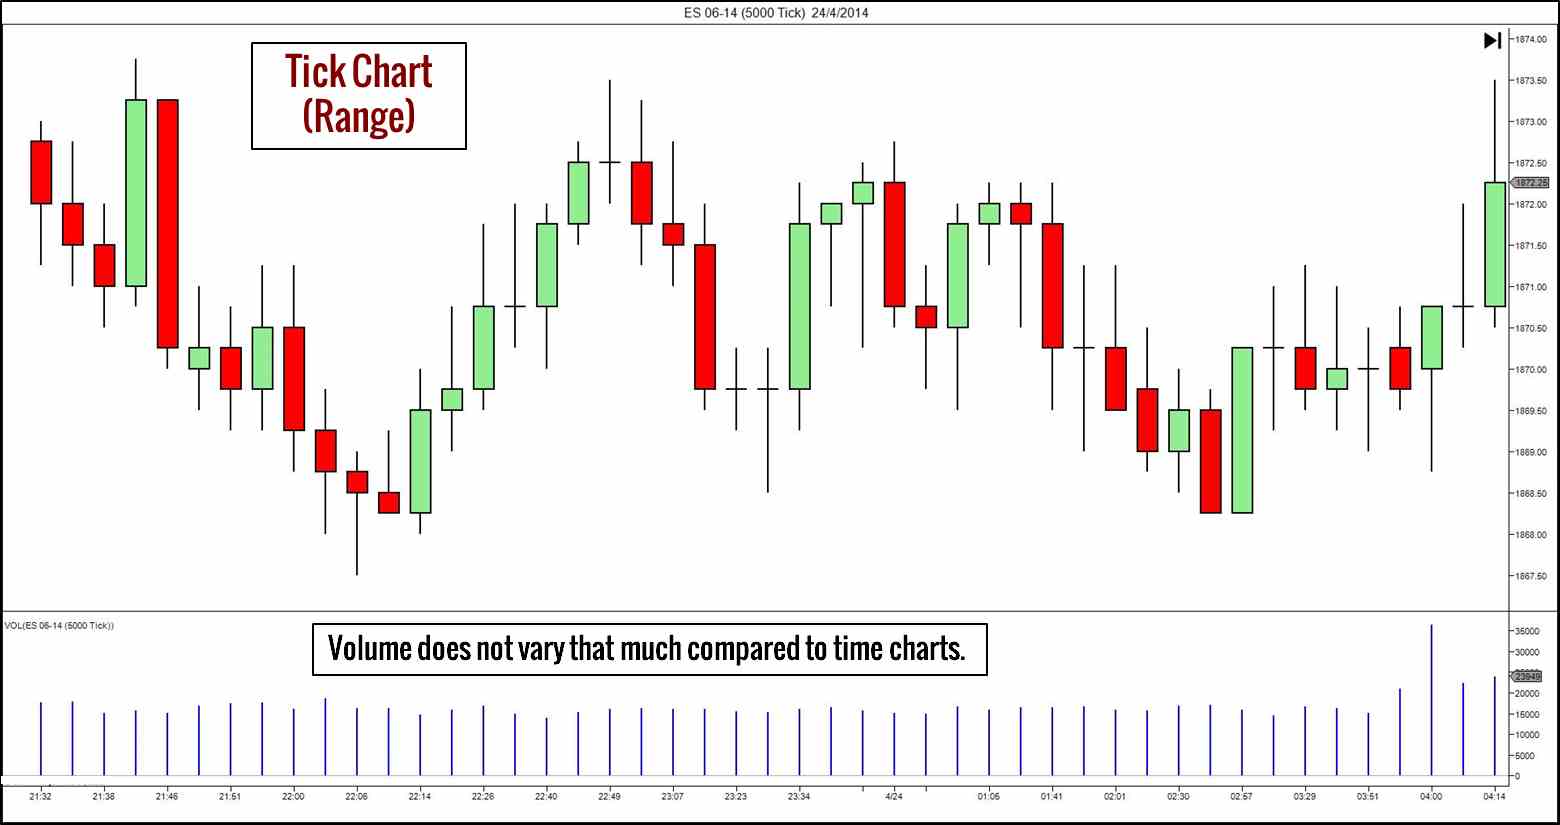
Tick Charts:
Tick charts are also the type of Intraday trading charts that are based on the level of market activity. Instead of using volume as an indicator of market activity level, they use ticks or number of transactions.
They represent a number of transactions, and each transaction has a different volume, so data shown by them is different from the volume charts.
Bars or candlesticks are formed and each bar/candlestick shows OHLC for a specified number of transactions. The number of ticks setting depends on the volatility of the market, although the most common options are 144-tick and 233-tick settings.
Tick charts work well in the markets with strong trends, as need by intraday traders, but they provide less variation in the volume of each tick bar.
You can read this review in Hindi as well.
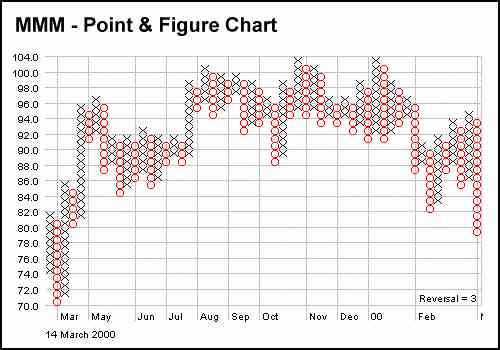
Point & Figure Charts:
Point & Figure Charts are the simple yet efficient Intraday trading charts that focus only on significant price moves, eliminating all the surrounding noise. The chart shows X’s and O’s with X representing rising prices and O representing falling prices.
The symbols are each placed in a box which represents an incremental time period like one day or a range of days as required. The box size and the reversal amount have to be predetermined and entered.
The unique feature of point & figure charts is that the time input is not used on a linear basis; as soon as the price rises or falls beyond a level, a new column is made.
For this to happen, the movement in price must be equal to or greater than the reversal distance. Also, the point & figure charts are more effective for daily and above time frames.
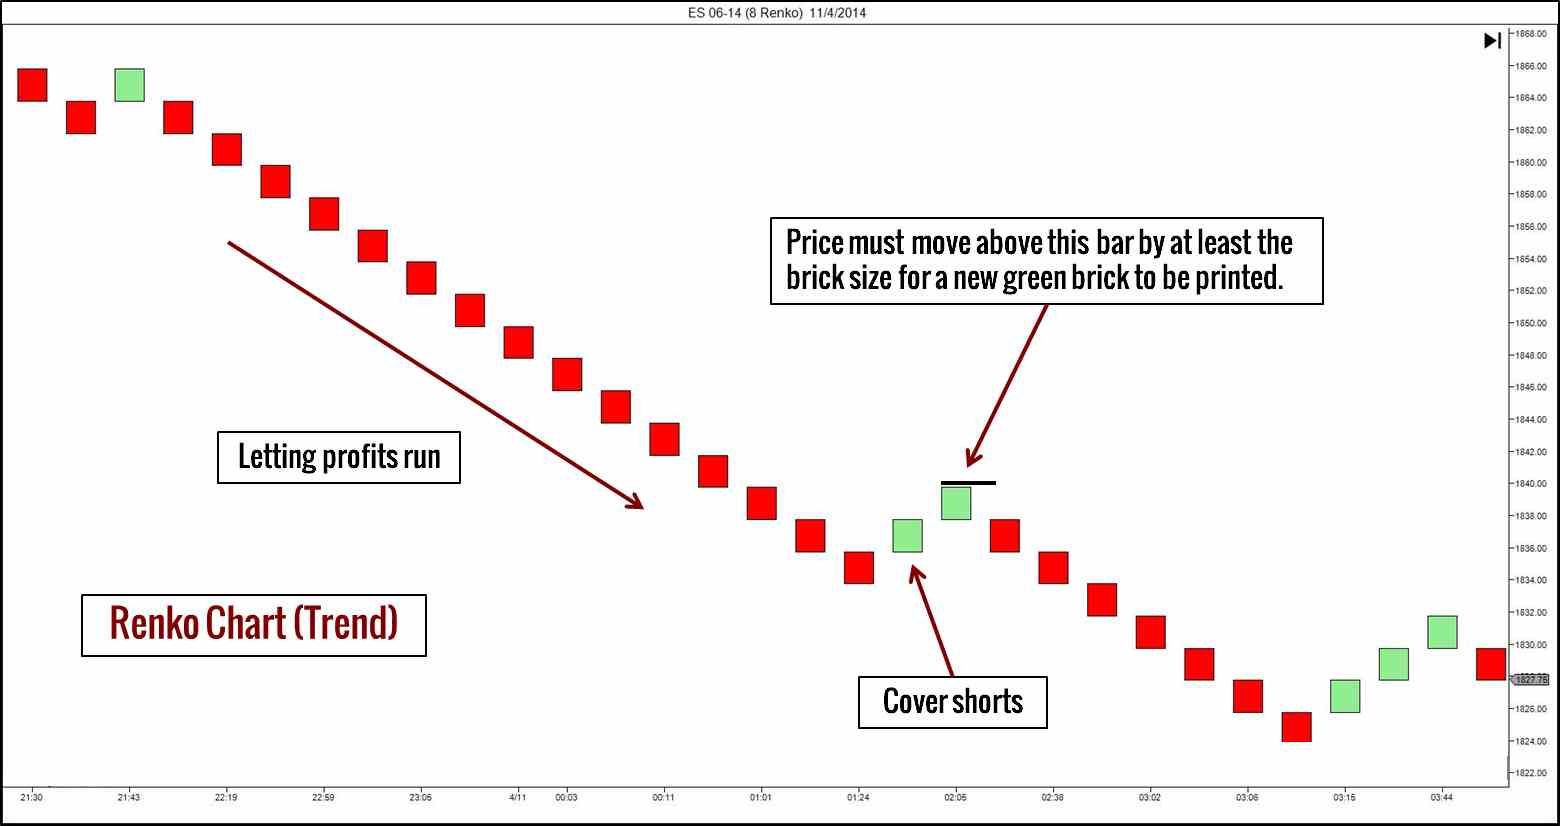
Renko Charts:
The work Renko is derived from a Japanese word for ‘brick’.
So, Renko charts show bricks, and the brick size needs to be specified. A new brick is formed when the market moves more than the brick size away from the preceding brick size.
Renko Charts do not show the exact price action, but it only highlights the important trends after removing the surrounding noise.
Therefore, Renko Charts are one of those intraday trading charts that can be effectively used to identify trends in a high time frame and also to guide the trader in letting the profits run.
Thus, we can see that there are multiple options available to an intraday trader with respect to the trading chart type that he wishes to choose.
Charts are the most fundamental aspect of technical analysis. An experienced trader is able to decide which type of chart will provide him with more information and assistance in which type of trade circumstances.
A trader needs to identify if he needs to use a time based or an activity-based chart, as both have their own strengths and weaknesses.
The choice of the intraday trading charts depends on the trader’s desired goals and the information he is seeking.
Therefore, choose the correct chart in order to avoid Intraday Trading Mistakes.
A trader must be experienced and flexible enough to switch from one chart type to the other based on the change in the requirements and the market, as the intraday markets are highly volatile and dynamic; and must know which information to use from the charts and which to discard.
Happy Trading!
In case you are looking to get started with Share Market trading and make profits using these intraday trading charts discussed above, just fill in some basic details below.
We will arrange a callback for you:
More on Share Market Education:
Summary
Reviewer
A Digital Blogger
Date
Broker Name
Intraday Trading Charts
Overall Rating
