


Looking for Low Brokerage, High Margin & Free Tips?
Intraday Trading Tools
| | Intraday Trading | 1 Comment
More on Intraday Trading
Intraday Trading Tools can make your life easy if you are an intraday trader. However, there are multiple questions one may have before he or she starts using these tools.
Thus, let’s start with a few basics to set some ground understanding of this trading segment.
Intraday trading is a challenging domain.
Along with gaining an understanding of what is intraday trading requires a lot of analysis and knowledge of technical aspects of charts and indicators.
Since it involves buying and selling securities on the same day, during the exchange trading hours it demands too much patience and awareness towards the market trends as one buy securities not with an intention of investment, but with the intent of harvesting profits due to the price fluctuations throughout the day.
It requires consistency, patience and very accurate knowledge of the market and market trends. Intraday traders operate with the highest levels of risks and participate in volatile market conditions.
For an established intraday trader, all these come on their own with time and they become experienced in making judgment calls and decisions; however, for beginners, they are mostly dependent on the various tools available to make an informed and profitable decision.
Intraday trading is riskier for untrained traders, but if they keep a vigilant eye on the market trends and the technical indicators, they can reap huge profits.
This, of course, needs a lot of hard work and discipline, however, the work can be made a little simpler by using the various Intraday Trading Tools and technologies available in the market. It makes total sense for a serious trader to learn intraday trading and make his/her life easy (and profitable).
Using the right intraday trading tools is critical to the success of a day trader.
Top 5 Intraday Trading Tools in India
Moving ahead, let’s talk about the most important intraday trading tools:
1. Trading Platforms
Multiple platforms or softwares are available for intraday trading. Some of those Intraday Trading Tools are TT (Trading Technologies) Trading Platform, Sharekhan Trade Tiger, Angel Broking Speed Pro, Zerodha Kite trading Platforms and so on.
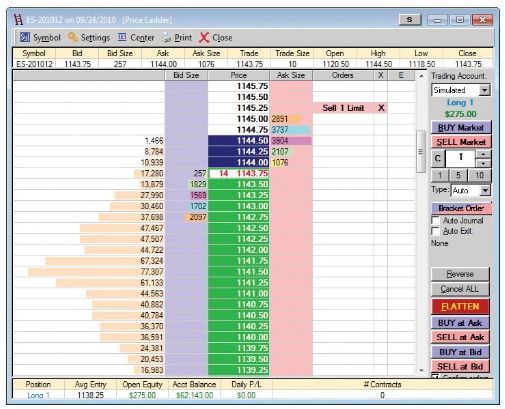
These platforms provide in-depth information about the volumes being traded, prices at which they are traded, bid-offer range, and make ladders to give an accurate picture to the trader.
Choosing the right trading platform will be the first step towards avoiding Intraday Trading Mistakes.
The trading platforms make a personalized risk profile for the traders based on their risk appetite, net worth, investment objective, etc., derive signals based on fundamental and technical analysis, and also execute the trades based on these signals.
Also Read: Best Stock Brokers for Intraday Trading
A trading platform is, basically, judged on the basis of real-time data it provides, the order execution speed, functionalities allowing to set up a trading strategy, flexibility, fee and must provide details of daily volumes and price on BSE and NSE.
Also, it is best to know the Intraday Trading Time to prevent yourself from uncertain risks.
Many intraday traders rely exclusively on price action, which is the movement of a security’s price, for making trading decisions and this price action is depicted by the trading platforms, making them an important decision-making source.
They are available in different languages to cater to a variety of users.
2. Charts
Charts are used by intraday traders to understand the movement in the markets and these have proven to be one of the top Intraday Trading Tools.
Charts, as one of the most sought out Intraday Trading Tools, help in intraday technical analysis by providing historical data, including the price movement.
The charts can be adjusted to show the particular time frame that the trader wants to be invested in hourly, 15 minutes, 5 minutes, daily or any duration thereof.
The ability to read the charts efficiently is a very important skill for a day trader to earn profits and be successful. It takes a lot of practice to become adept at it. The most important aspect is to study and analyze how the charts react to certain events.
Real-time charts, with a variety of patterns, are provided by companies like Reuters, Bloomberg and S&P to name a few.
Charts give detailed information about the opening, closing, high and low of the security trade in the defined time interval.
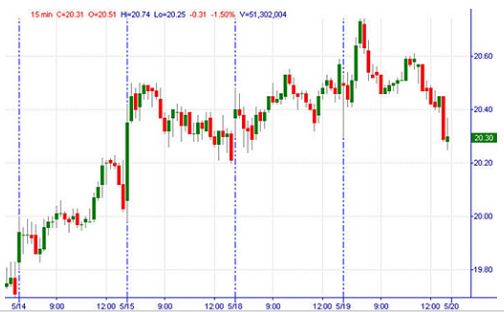
For instance, in the 15-minutes intraday chart shown below, etc candlestick shows the opening, closing, high and low of each 15-minute interval for the time period.
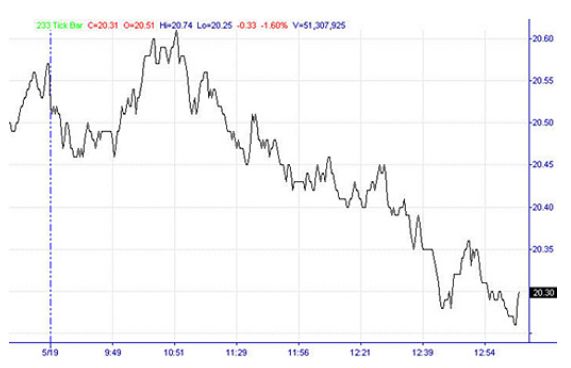
In addition to the defined time-period charts, there are also the intraday tick/trade charts, which are the line charts that represent each trade the market executes.
Each trade is represented, irrespective of the time. So, for a market with no trades, the tick chart will be a flat line and for a highly liquid market the tick chart is constantly moving up and down.
You can read this review in Hindi as well.
3. Technical Indicators
Technical Indicators are used in conjunction with the charts to get a deeper and more useful analysis. These indicators predict the future prices, or the price direction, by looking at the past patterns.
Technical indicators are majorly used in short-term or intraday trades as they do not look at the fundamental basics and analyze only short-term price movements.
They are derived by applying an intraday trading formula to the price data; some indicators use only the closing prices, while others may include the volume and open prices as well. They provide a unique perspective regarding in which direction and how much is the price expected to move.
These indicators may help to alert the trader, to confirm the findings of technical analysis tools and predict future price movements.
In other words, these technical indicators can be a great asset for a successful intraday trader and work as great options as Intraday Trading Tools.
Some of these Technical Indicators are as follows:
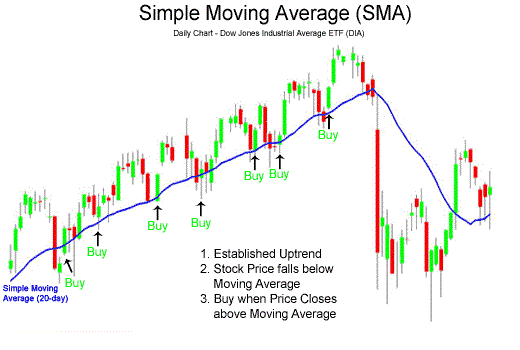
Moving Averages
This indicator calculates the average price of a security over a specified period of time. For example, a 10-day moving average provides the average price for the last 10 days.
It helps in smoothening the volatility in price movement and providing a clearer picture as it is difficult to analyze a trend from volatile fluctuations.
They are called Overlays as they overlap the price movement.
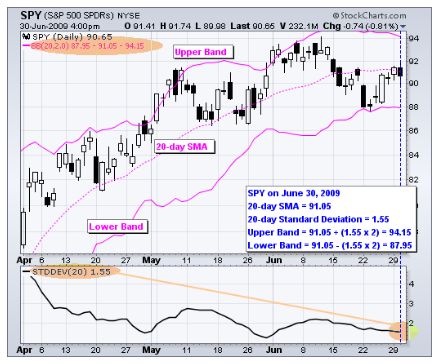
Bollinger Bands
Bollinger Bands are also Overlays, as they also follow price movement. They are the volatility bands that are placed above and below a moving average. The bands widen when volatility increases and narrow when the volatility decreases.
Bollinger Bands consist of a middle band which is the simple moving average, with an upper band and a lower band which are the standard deviations.
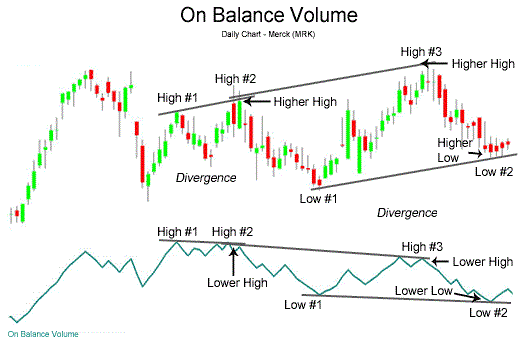
On Balance Volume
It is a Volume indicator that combines volume and price to determine the buying and selling pressure. This indicator determines how strong a trend is.
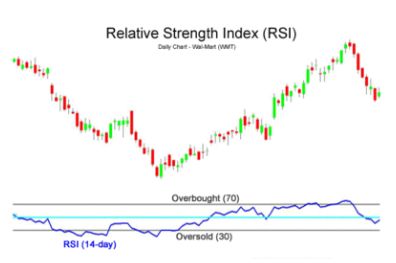
Relative Strength Index (RSI)
RSI is a momentum indicator and it falls under the category of Oscillators as it flows up and down, between upper and lower bounds. It compares the recent gain and loss in intraday trading to measure the speed and change of price movements and thus, identifies overbought and oversold conditions.
However, sudden large price movements may lead to false signals on RSI, so this must usually be used in conjunction with other technical indicators.
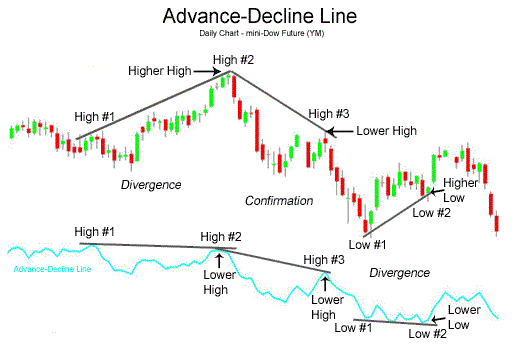
Advance-Decline Line
It is a Breadth Indicator that works upon the trader sentiments. It is based on Net Advances, which means the number of advancing stocks minus the number of declining stocks.
All of these technical indicators mentioned above along with a few more work perfectly as some of the top Intraday Trading Tools, especially for traders who are an expert in this trading domain.
4. Live News Feed
The most critical factor in intraday trading is the short-term trade and the immediate effects that are brought about by the market on the price movement of securities.
In order to capture and harvest the opportunity, the intraday traders have to stay abreast with the breaking news and obtain this news in real-time so that they can predict or calculate the effect of the news on the prices of securities and take an action or position accordingly.
The trader who finds and imbibes the right breaking news at the right time has an upper hand. News can either be used directly, or they can be used to understand the catalyst that caused the news and may affect other securities and movements as well.
For example, when a stock price suddenly goes up, the day trader searches the live news feed and finds news about ICICI Direct. Now this news can directly affect the price movements of ICICI Direct’s stock, along with being a catalyst to cause other price movements in a related technology or other companies’ stocks.
A lot of times, these breaking news turn out to be rumors or speculations, however, they still impact the market. Therefore, it is often said, buy the rumor, sell the news!
This is to be kept in mind that the speculation that sent the market up, will also bring the market down after some time when the rumor remains unconfirmed or is confirmed to be false or fake. Breaking news mostly works by trading on momentum.
Therefore, Live News Feed is one of those phenomenal intraday trading tools that helps in decision-making by the day traders.
There are various best intraday trading apps too that provide real-time breaking news to the traders to help them stay informed. Some of them are Moneycontrol, Yahoo! Finance and Investor.
Interestingly, there are certain news feed providers that specialize in breaking news and real-time data about specific products and commodities. For instance, Platts provides all possible information and the latest live news feed on Oil, Energy and Metals.
5. Live Radio Feed
Another tool to provide day traders with faster and real-time news is Live Radio Feed. It works way faster than the breaking news and helps the traders to react faster and make more informed decisions based on global, corporate and stock market-related events.
The live radio feed is broadcasted 24 hours a day on all working days and covers news about all the major asset classes like equity, commodities, fixed income and foreign exchange.
The radio feed functions as an analyst wherein the news feed from websites, TV channels, blogs and social media are accumulated, analyzed and presented in a concise, palatable manner, which enables the traders to make quick buy/sell decisions, and quickness is the trick of the trade-in intraday trading!
One such live radio service in India is run by LKP Securities and is called LKP 194.8. It is a real-time market moving radio, which helps the participants to hear the news and act upon it faster.
It provides 24 hours broadcast on various stocks, RBI monetary policies, big corporate press conferences, all government news, earnings of companies listed on BSE and NSE, specific category stock information like pharma and auto, and all global, commodities and crude data.
Thus, as discussed, the intraday trading tools play a very crucial role in helping the intraday traders make a quick, informed and profitable decision, after factoring in all aspects, taking in all input and analyzing it to reach a definitive conclusion, on how, when and how much to trade within the day.
In case, you are looking to perform intraday trading but do not know which stockbroker suits you the best for you, just fill in your details below.
We will arrange a callback for you, absolutely free!
More on Share Market Education:
If you wish to learn more about share market, here are a few references for you:
Summary
Reviewer
A Digital Blogger
Date
Broker Name
Intraday Trading Tools
Overall Rating

One Comment
Really it’s Best Blogs on Indian Stock Market……keep it up.
Thanks for giving the information.