


Looking for Low Brokerage, High Margin & Free Tips?
RSI Strategy for Intraday
More On Technical Indicators
Do you rely on technical indicators for intraday trading? Are you using RSI or other similar indicators? Do you get the right information out of it? If not, then might be you are not using them in the right way. To help you with, here we are with the complete description of the RSI strategy for intraday.
So let’s get started!
RSI Strategy for Intraday Trading
Have you ever driven a car? What do you do when you have to take a U-turn?
You slow down the speed. Right?
It means whenever you are about to change the direction it is depicted by the change in speed of the vehicle.
Similar is the case of the RSI indicator in technical analysis. Since it is a momentum oscillator indicator, it gives an indication of price reversal.
The general scale of the RSI indicator is 0-100 and to read & understand it most of the trade set it in the range of 30-70.
This range clearly depicts the oversold and overbought condition of the share and thus helps the trader in understanding the upcoming trend of the market.
Wondering how?
Here the value of 30 or below indicates that the stock has been oversold and the price of the stock has been fallen down below the market expectation.
The reverse situation arises when the RSI value crosses beyond the 70 value. Here, it means that buyers are more active in the market that will eventually lead to a fall in the price.
So as a trader, what kind of trading decision you would take at each point?
Since at the value of 30 the price is expected to fall below the expected range, hence it creates the opportunity for the traders to go long. On the other hand, at RSI 70, the value of the share price is generally high and thus the trader can reap the benefit of the condition short selling.
Best RSI Period for Intraday
After discussing the RSI intraday trading strategy now comes the period of RSI i.e. generally kept 14. The period in the RSI indicator gives us the information of calculation done using the last 14 candles or bars in the chart.
So what do you think should be the right period for RSI for intraday trading? Should it be the same as the default?
Since intraday trading is short-term trading and hence it is good to understand the market movement closely in order to get better results.
So, here using the RSI value of as low as 5 or as high as 8 can give you better results as it increases the sensitivity of the indicator.
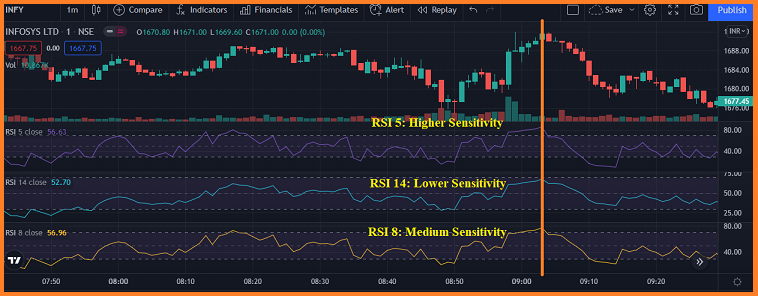
To get a better understanding of the technical analysis of stocks using RSI let’s look at the chart below:
Now in the above chart, we have set three different periods for RSI keeping all other conditions the same like:
- Range 70-30
- Chart: 1 Day
- Time Frame: 1 minute
At this point, the price is ranging around the market shows a temporary reversal. Now to get the idea of this reversion which time period gives you the better signal.
Of course the one with RSI 5. Here the RSI 5 shows the overbought condition much earlier than the other two. Thus, the trader can make a quick decision using the indicator with the shortest time frame.
It is there the trader can reap the benefit by going short and waiting for the time until another reversal of trend is observed.
So, depending upon your preference, pick the right range of the RSI indicator to make the best profit within the day.
Best RSI Setting for Intraday
We talked about the ideal range, and further about the period of the RSI that can give you better results, but here is the question and the basic challenge for the beginners?
How to do RSI setting for using it for technical analysis for intraday trading?
If you too are stuck then here is the solution for you. To help you with the same, here is the TradingView chart with the help of which you will get the complete demonstration of using it for stock trend analysis.
- Go to Tradingview or the open charts in your trading platform.
- Click on Indicators on the top bar
- Select the RSI indicator.
- The indicator will be displayed on the screen.
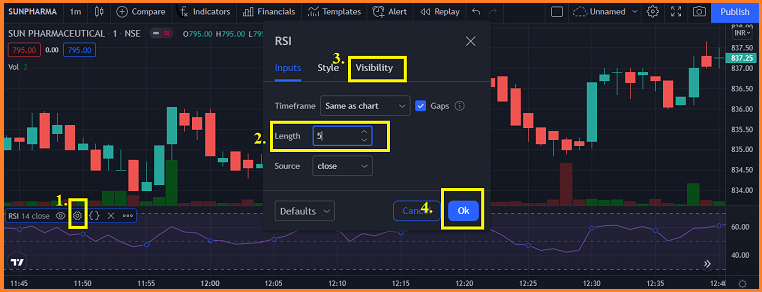
After this follow the steps below:
- Now select the indicator and click on the ‘Setting’ option.
- Click on ‘Inputs’ and select the period (14-period is set as default).
- Also, you can use the ‘Visibility’ feature for a better display.
- Click on ‘OK’.
Read the chart with the help of indicators and make the trading decisions accordingly.
How to Use RSI in Intraday for Trend Reversal?
The stock market is highly volatile, it is hard to predict when the market can go down. But with RSI divergence you can actually understand the market upcoming trend and behave accordingly.
Confused again?
Wait! let’s make it easier for you.
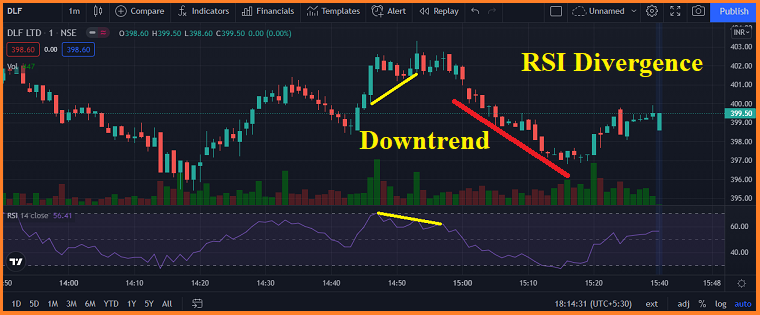
Look at the chart below:
In the above chart, the RSI indicator is making a lower high and lower low, on the other hand, the price shows higher high and higher low values.
This is where you get a clear indication of a trend reversal.
It is the sign that soon the market is going to reverse and traders in the long position should exit by booking their profit.
On the other hand, the traders who missed the opportunity to make a profit from the long position can go short.
This is how RSI divergence help traders in predicting the trend reversal and in making the right decision beforehand.
When it comes to getting the appropriate results then it is good to go for the combination of some of the best intraday trading indicators. This will help you in picking the right value at which you can enter or exit the trade.
No doubt, for many beginners this concept is a little difficult to understand. But you can enhance your learning and understanding of the topic by reading some of the best Technical Analysis Books.
There are many available books online and offline that helps a beginner in enhancing and improving their knowledge of stock market analysis.
Conclusion
This is the RSI strategy for intraday trading that helps traders to trade strategically and to reap more profit in the trending and volatile market conditions.
So, what are you waiting for?
Choose the stockbroker with valuable services and the trading platform with the intuitive interface and charts to do proper technical analysis and trade to earn maximum profit.
Want to begin your investment and trading journey with the renowned stockbroker in India, get in touch with us now and open your Demat account online for FREE!
More on Intraday Trading