


Looking for Low Brokerage, High Margin & Free Tips?
Volume by Price Indicator
More On Technical Indicators
Volume by Price indicator is one of the trusted leading trend indicators. If you are someone who is looking forward to one of the best Volume trading strategies, then you have come to the right place to be affluent in your trading career.
The skillful traders use volume to forecast the investors’ interest in the market, use their way of sensing accumulation anterior to up momentum and distribution before a downward momentum.
Volume by Price Indicator Explained
The volume by price indicator gives you the liberty to become a professional trader without any worries.
The particular insights you can gain by using volume by price indicator will provide you with the ability to trade with great vigor. The compelling indicator, Volume by Price, performs over 300 calculations per bar and provides the necessary nuts and bolts of the tools and methodology.
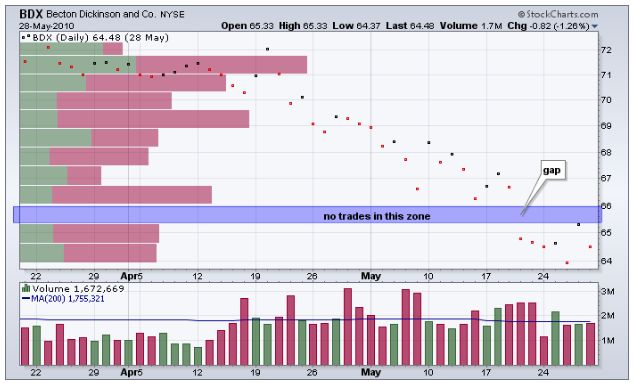
The Volume by Price indicator chart is a horizontal histogram plotted on a graph showing the volumes of shares traded at a specific price level. These histograms appear on the Y-axis of the chart, and skillful traders have been using it to forecast the areas of support and resistance of the securities.
The chart uses closing prices for generating the price indication, and the price indication demonstrates the volume of a particular price range.
On the left side of the chart, you can see the Volume by Price indicator bars, which coincide with the changes in price. It will appear in a single color or double color to denote the ‘up volume and ‘down volume.’
When you want to check the volume and closing prices, these kinds of indicators can be used to detect high volume price ranges, which will help to understand the support or resistance. By default, the stock chart can show 12 Volume by Price indicator bars.
However, a trader can set the price bar by increasing or decreasing the way how he wants to have it.
Don’t worry if you are getting a bit confused. Let’s break it down for you!
How To Use Volume by Price Indicator?
The Volume by price indicator comes with the following operational methodology:
- The Volume indicates the strength of a trend or its weakness.
- An increase in volume indicates the rising interest.
- A decline in interest can identify by looking into the decrease in volume.
- Price reversal can identify by checking the extreme volume.
- The points where the market trades on high volume are the points of strong support and resistance.
- Price movements (both up and down) can be verified with the help of the Volume by Price indicator.
Volume and market strategy:
If the market is rising, we can see the volume gets increased automatically.
The buyers need increasing volume, and if it grows, they will have a high spirit of enthusiasm to keep the prices pushing higher. If the price increases and volume shows a decrease, then it is a warning of an expected potential reversal.
Keep your eyes open during such instances!
The analysis behind this finding is that we get a strong signal indicating some fundamental changes when the price drops on massive volume.
Volume by Price trend indicator helps to find out the price direction of the securities and strength of price change.
The indicator comprises of cumulative volume line that adds or deducts a multiple of the percentage change in a share’s price trend and current volume, which purely depends on the upward or downward fluctuations of the securities.
Volume by Price Indicator Mechanism
Volume by Price can be calculated by using the entire period on the chart.
For example, Volume by Price on a seven-month daily chart will use all seven months of the closing price.
Similarly, the Volume by Price indicator based on a two-year weekly chart will be showing two years of the closing price.
The Volume by Price indicator calculations do not outspread beyond the historical data on the chart.
To calculate the Volume by Price indicator, it adapts 4 basic steps based on the default parameter setting and closing price.
- It checks high-low closing prices for a specific set period.
- To create identical prices, it divides the range by 12.
- Within each price zone, it adds the amount of volume traded.
- Divide the volume into up volume and down volume if needed.
It has to be noted that volume becomes negative when the closing price moves down from one period to the next volume. Also, the volume becomes positive when the closing price moves up from one period to the next period.
Volume by Price Indicator Charts:
Volume by Price indicator has immense ability to check current and future support and resistance levels of securities.
In the chart, price zones with high volume, you can see the elevated interest levels which can potentially influence the future supply.
During a planned pullback (pullback meaning), large Volume by Price bars below the prices may be highly supportive. Similarly, long Volume by Price indicator bars above prices should be noticed as potential resistance on a bounce.
If the price breaks above or below, Volume by Price bars can also be used as potential trade signals.
The indication of strength is identifiable when you see a break above the long bar because it helps us to assume that the demand is sufficient enough to run over the supply.
Similarly, the chart can give a weak position indication when the break is below the long bar because the market has enough supply to match the demand.
It is imperative to know the working mechanism of Volume by Price before you dissect through some of the samples, which can give you a better understanding of the subject. Volume by Price can use to validate current support or resistance.
Since the indicator generated based on price-volume data, you cannot use it to validate previous support or resistance levels. The below-mentioned chart can illustrate it clearly.
In the appended chart, it deals with six months of data, and it runs from January to June, and you can find a support level in March.
But for a precise understanding of the support level, the indicator data must move beyond March, and in the chart, you can see the data moved beyond March and ends in June.
You know what, let’s understand it with the help of an example so that you never forget it.
Volume by Price indicator Example:
Volume by Price indicator resembles much similar to On-balance Volume.
In the On-balance volume indicator, fluctuations are visible subject to the price movements. When the price moves high or low, the index also reflects the changes correspondingly.
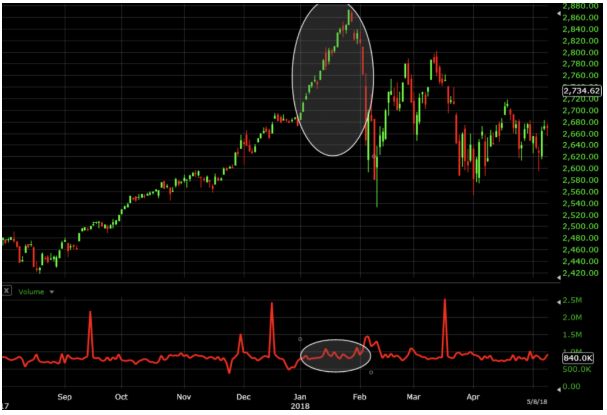
As per the general principle conceived in Volume by Price, the indicator should move along the price direction. By observing the signs, we can assume that the market may experience a reverse trend when the price movement has low volume support.
In the above chart, the market’s uptrend opened up despite no apparent changes in volume. We can observe here that once volume entered in the market, the price could decline. A Volume by Price indicator can measure as volume multiplied by the change in price, and it can again calculate as a running total from the previous period.
VPT= previous VPT + volume x (Today’s close – previous close)/ previous close
Some charting software platforms cannot provide volume data based on a specific timeframe lower than the daily level. Thereby it restricts the trader to trade using the Volume by Price indicator over multiple time intervals.
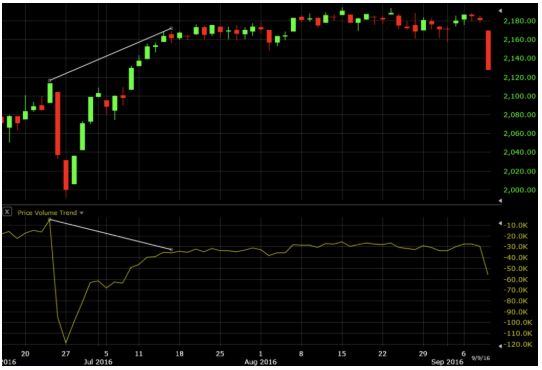
In the above example, Volume by price indicator actually declines over some time. The upward trend is relatively weak, and you cannot expect this phenomenon to stay for an extended period. So, we can expect a subsequent drop in the overall market trend.
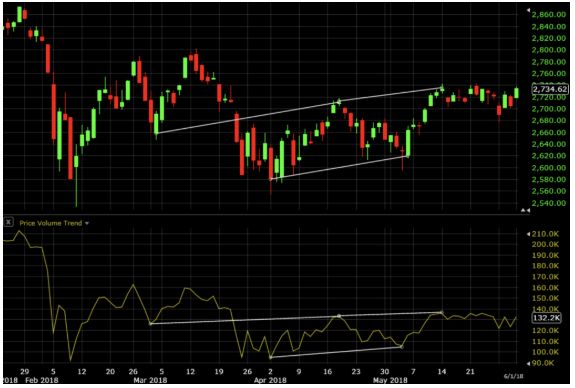
We can see the peaks and troughs in price under Volume by Price trend. Even we can see some bearish nature divergences.
According to Volume by Price indicator analysis, it indicates that when the upward movement in the market is relatively weak, it denotes the bullish trends.
The extended green portions reflect more demand which can further validate for support. Extended red parts reflect more supply which can further confirm for its resistance.
Volume by price indicator Strengths:
Here are some of the benefits of using the Volume by Price indicator in your trading analysis:
- Volume by price indicator reduces the noise of the market.
- Able to see market psychology both in time and price.
- Easy to view as volume increases as price rises.
- Easy to use for the traders at the beginner level.
- Calculations are incredibly simple.
- It provides a detailed snapshot of company activity.
- Ease of use.
- As volume by price indicator based on statistics, decisions can break down into probabilities which helps the traders to take quick decisions.
- Offer the best safety parameters.
- It is one of the useful tools to control unnecessary market noise.
Volume by price indicator Weaknesses:
At the same time, here are a few concerns about Volume by Price indicator you must be aware of:
- Limited information provided in case of multi-product operation.
- Volume by price indicator analysis has a built-in set of rigid assumptions, and sometimes it is inflexible
- Low accuracy and precise information.
Conclusion:
Volume by rice analysis is a superintending accounting technique using to analyze how changes in price and volume affect the changing company profit. It has been using in business and trade.
The trend is also helpful in identifying the present support and resistance. Hence it can further enhance its utility position by looking at the positive and negative volume within the volume by price bars.
Volume by Price indicator can use effectively along with Momentum Oscillators and Chart Patterns for a better result because both can support Volume by Price to improve its predictability.
Also, volume alone cannot provide you with positive signals for buying and selling. However, it gives you further insights into the overall health of a trend.
By analyzing the trends of previous volume indicator results, you can focus on the price movements and take the call for buying or selling based on the market trend, and make necessary corrections when required. So, be mindful about the volume indicators and follow the trends you notice because it is your hard-earned money.
It is your appraisal that can make it a Bullish or Bearish trend. Hence, it is utmost important to have up-to-date analysis to stimulate the profit to fabricate your managerial decision-making.
In case you are looking to get started with stock market trading or investments while using some of the high-tech trading platforms, let us assist you in this:
Summary
Reviewer
A Digital Blogger
Date
Broker Name
Volume by Price Indicator
Overall Rating
