


Looking for Low Brokerage, High Margin & Free Tips?
Volume Weighted Average Price
More On Technical Indicators
Volume weighted average price or VWAP technical indicator or trading strategy is used for short term and intraday trading. The method is exactly how it sounds like; the rupees traded are added with every transaction and then the total is divided by the total shares bought in a day.
The focus of the trader while using this technical indicator is on the volume of transactions at a particular price and not on the closing price.
VWAP tends to answer various important questions such as – will the stock be closed with low volume at a high? Or will the stock move with high volume to a new low?
Not only is this method beneficial for day traders but swing traders as well. However VWAP is exclusively limited to day trading, this will not show up on extensive time (weekly, monthly) period.
Volume Weighted Average Price Basics
Along with other intraday charts, Volume weighted average price is also used to identify the movement of intraday stock price.
When the price is above VWAP, it indicates that the security is of value or cheap. When the price is below VWAP, it suggests that the stock is expensive. Thus traders buy the stock when price crosses VWAP.
Isn’t this an ideal way a technical indicator should work like?
Another way to use Volume weighted average price can be – as a gage for trade fills. In this case, the volume is a significant component when it comes to determining the liquidity of a market. Hence, if a long trade crosses the VWAP line, it might be regarded as a trade fill which is non-optimal.
VWAP is an analysis tool and not a decider for you on when to enter/exit the market.
The calculation of VWAP commences with the opening of trading and ceases when the trading finishes.
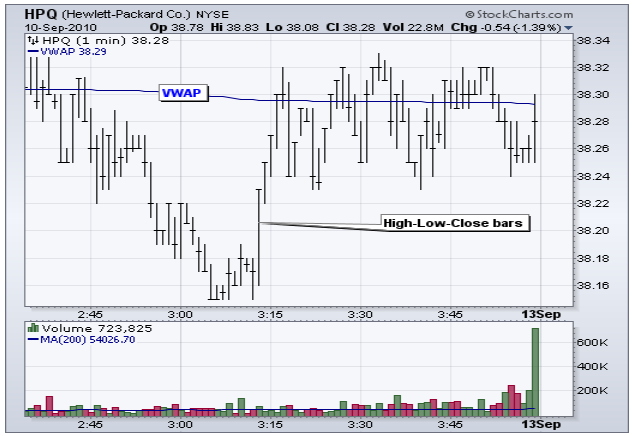
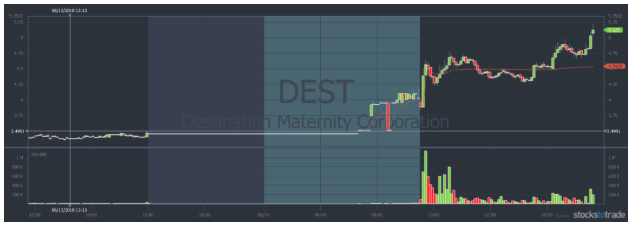
Given above is a classic example of VWAP chart using tick data or number of trades happening in a day. As you can guess, several trades happen each minute of the day. For active securities, it can extend up to 30 to 40 ticks in just one minute.
So for a usual trading day, several securities end up with more than 5,000 ticks. Traders use VWAP in a short time frame as support and resistance.
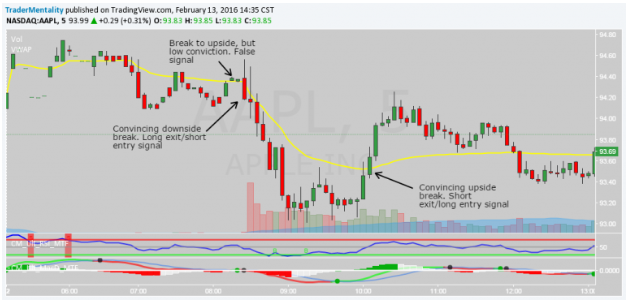
Let’s have a look at the new version of VWAP chart which is not based on tick data but hon intraday period (1, 5, 30, 60 minutes charts).
In the given above chart, VWAP is applied on a 5 minutes intraday chart. Most of the traders prefer this method more than based on tick data because that requires a massive amount of market data as all the ticks for different period need to be referenced.
For many traders, the end of the day VWAP values is not of great significance, as the lag becomes very prominent and the indicator tends to flatten out at that time. They focus more on the value present at the start of the day.
However, for big institutions, this value at the end is of more importance. Because at the end of the day value provides a yardstick for these institutions to compare their transactions.
Volume Weighted Average Price Example
As already mentioned above, VWAP charts are using by traders to determine the support and resistance. It is important as it plays a pivotal role in winning and losing. There are many ways to calculate support and resistance such as moving averages.
VWAP has remarkable similarities with other moving averages; hence it can use for identifying the support and resistance.
While using VWAP, it also shows lags similar to other moving averages. The reason for, this is because it uses past data. In fact, the more data that is present, higher will be the lag.
However, the significant difference between these two would be that VWAP is mainly considered as an analysis tool and not as a trade signal tool.
There are 3 basic setups in case of VWAP, and they are pullbacks, fade to VWAP and breakout pattern. VWAP pullback is more popular of the two and significantly used by the day traders.
Learn More: Pullback Meaning
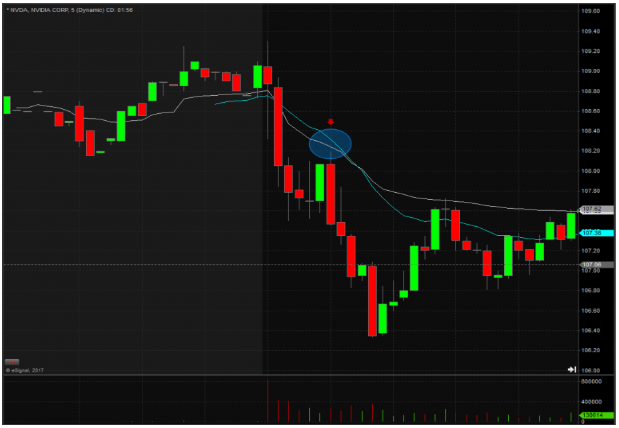
The Pullback VWAP
It is a 5-minute chart of NVDA made using VWAP pullback setup. In the chart, you can see two lines present. The white line is VWAP whereas the teal line represents a 20-day moving average. A pullback happens when the security peaks and then fallbacks (pullback) to some extent.
However falling back of security does not imply that the stock is on a decent and will not rise anytime soon. It just implies that maybe there was a sort of positive reagent present that caused a little high demand for a short amount of time.
To make the best use of this pattern, several traders tend to go short when prices close below VWAP and buy when prices close above it.
Traders adopt another method that for the first few candles, they let the market make a move and then wait for it to get pulled back to VWAP to either get short or long with the going trend in the direction where the market is moving.
A Pullback Volume Weighted Average price strategy is a preferable strategy usually adopted by aggressive traders that love to take risks. Traders need to have a lot of confidence as timing out this pattern needs a huge amount of practice.
One can benefit immensely from this trend by being smart about their timing.
Fade to VWAP method:
Given above is a one-minute SPY chart prepared with Fade to VWAP strategy. The strategy is great if you want to understand the risk and reward.
The SPY in the morning had a great high however later it failed to make new ones. It indicates that there are only a few buyers and the price is going to take a reverse turn.
With this strategy, traders take a short in the direction of highs and stop just above the price target which is VWAP.
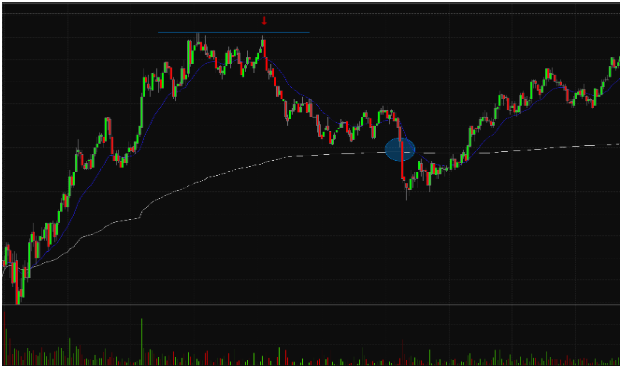
Breakout pattern:
Given above is a VWAP chart based on breakout pattern. It is best suitable for new traders that are risk-averse. A breakout happens when a security moves out of support or resistance level with greater volume.
The traders need to wait till the securities go under VWAP. It would be a great time to gain entry. Traders hope that the security will recover and go back to the upward movement and they will profit by taking a long position.
Volume Weighted Average Price Calculation
The calculation related to Volume Weighted Average Price is pretty straight-forward, however, you need to be cautious in each of the steps as mentioned below:
- As a first step, you need to start calculating the price for the intraday period. It can also be computed by using the formula : (High price + Low price + Closing price )/3
- Now multiply the above-calculated price with the volume of the period.
- Third, you do the cumulative total of the (Price x Volume).
- Next step is taking the volume of the cumulative total.
- Divide the cumulative totals of step 3 and step 4.
Formula wise, you need to know this:
VWAP = cumulative (Volume x Price)/ cumulative volume.
Volume Weighted Average Price Advantages
- The technique of VWAP is simple and easy to calculate and comprehend.
- Helps traders to determine the best price to buy and sell the security keeping in consideration the volume of the market.
- This method is particularly useful when the trade involves a large number of shares.
- It is highly popular among the traders globally because of its simplicity and potential success.
Volume Weighted Average Price Disadvantages
- VWAP is a cumulative based method, i.e. it uses a large amount of data. And this data is only going to increase during the day. Having dependent on this volume of data causes lags in VWAP, similarly to that present in moving averages. In fact, the more data is present, the more the lag is going to be.
Because of this, it is preferable only to make use of one minute and five minutes chart and not the tick method to get the most accurate results.
The greater is the time frame of the candles, the less useful will be the VWAP indicator for the analysis purpose due to the lags present.
Conclusion:
Volume Weight Average Price is one of the most popular trading strategy practised by investors. It is a profoundly simple and effective method used to assess the trend or direction of security.
If you are planning to invest and then get out of security real quick, you need to have an indicator to show you the trend and help you make an informed decision, and that is what VWAP does.
Volume weighted average price is so useful for intraday trading that some traders consider it as the Holy Grail. They use it to compare with the current price of the stock to determine whether a stock is cheap or expensive on a same-day basis.
They also use it to check the quality of their performance at the end of the day if they took a position on that specific stock.
Vwap begins afresh for every trading day and is a highly versatile indicator. However one must be aware of its shortcomings about the lags present which in fact are true for any indicator that makes uses of the past data.
In case you are looking to get started with your stock market trades, here is how you can get started:
Summary
Reviewer
A Digital Blogger
Date
Broker Name
Volume Weighted Average Price
Overall Rating
