


Looking for Low Brokerage, High Margin & Free Tips?
Support and Resistance
| | Research | No Comments
More on Share Market Analysis
Support and resistance levels are something that is generally heard a lot of in the stock market technical analysis. But, what is it all about? The answer is simple – it is an effective technical analysis pattern.
Let’s dig a bit deeper to understand the intricacies involved around this concept.
Support And Resistance – Basics
Support is basically a price level at which due to demand concentration a downtrend is expected to pause. When the security price drops down, the demand for shares increases. This results in the creation of a support line.
Increase in prices causes a resistance zone to rise because of sell-off. For finding the potential trade entry or exit points, it is important to identify the zone of support as well as resistance.
‘Battlelines’ in the chart can be defined as the levels of support and resistance where the most trading occurs. These levels can be identified by technical analysis or trend lines.
Pivot point calculations can also be done for the identification of these levels. Each of the levels has its own pros and cons that must be considered while investing in the stock market.
Support And Resistance: How it Works?
No doubt, support, and resistance is a juncture where the forces of supply and demand meet. Let’s understand the support and resistance to get an idea about how it works.
At support level, the demand needs to be strong enough to prevent the price from declining. If the price will get cheap and declines towards the support, then buyers will tend to buy and sellers will be inclined to sell the shares.
When the price of the share reaches the level of support, demand will control the supply. This’ll result in preventing the price from falling down below the support level.
The logic behind the resistance is that if the price of the shares gets closer to the resistance then sellers will tend to sell the shares and buyers will show less interest in buying.
When the price will reach the resistance level, demand will be controlled by the supply resulting in prevention of price to rise above the resistance. This was all about how these two parameters work in the stock market.
Let’s now understand about the scientific study about these two parameters.
Length of frequency – It is believed that if the price stays longer on any certain level then that level gets stronger as well as important.
Trading at key levels – It is believed if there’s any heavy trading volume at a support or resistance then it will display the importance of that certain level. In terms of indicators, volume combination of support and resistance is used by many traders.
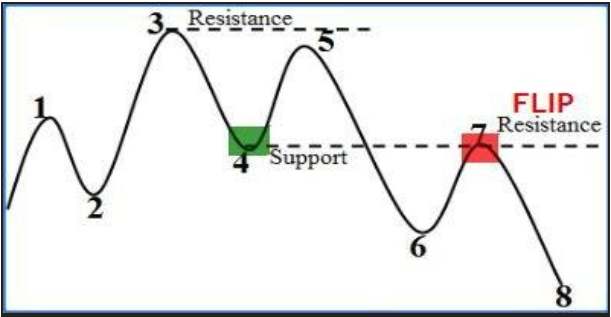
Role swapping – There are many instances when both the parameters can switch their roles. This role swapping will happen when a previous support level is spilt. On splitting, prices will make an attempt to revive which will help in turning it into a new level of resistance.
It can be said in simple words that, both the parameters are specific points on a chart that helps to attract a huge amount of either selling or buying.
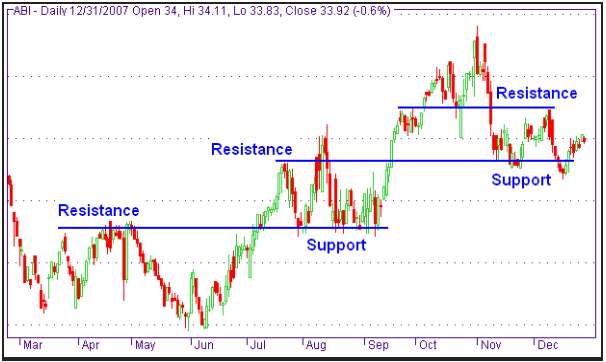
Support and Resistance – Example
Understanding the concept of these two parameters i.e. Support and Resistance, in a theoretical manner can be a bit difficult and confusing for the people who are relatively new to the world of stock market. To make this concept simple and easy, let’s understand the concept with the help of an example.
There are times when some levels in chart work as either support or resistance. These parameters are created by anyone. They just get formed with the passage of time depending on the action of different market participants.
Let’s say a market stock is trading very close to ₹90 but falls down at ₹80.
The investor who lost the opportunity to sell at ₹90 will regret that he would have gained profit on selling on time. He would again try to sell the stock and wait if the price reaches to ₹90 once again.
This entire situation will increase the selling pressure of the investor. This completely explains why and how the previous tops can become resistance in the future.
If the price will again reach ₹90, there will be another set of people who would feel bad that they would have bought the stock at 80. They will again wait to buy the stock if the price lowers to ₹80. This results in turning the previous bottom in support points.
Thus, this expectation of price movement at both low or high levels creates market movements by market participants themselves, resulting in the support and resistance mechanism.
Support and Resistance – Benefits
There are many positive aspects of these levels that need to be discussed in brief. Some of them are listed below:
- These levels are considered an important part of trend analysis. These levels can be used in different ways to make specific trading decisions by the investors. Along with this, it also helps in determining when a trend is about to reverse.
- Both the levels are beneficial in testing and confirming the trends.
- SR levels act as important supply and demand determinants for those who’re new to the share trading market.
- If the price remains between these two levels then the trend is likely to continue in the prevailing direction.
- One of the best points of these SR levels is that the use of price action trading will help in enhancing the trade entry of the investor.
- Another major benefit of SR level is that it provides great risk to reward ratio for those trades that work according to plan.
- With SR level, there’s less chance to stop permanently as stop loss is tight and is placed at perfect locations.
Support and Resistance – Concerns
Along with a long list of pros of SR levels, there are some important cons that are associated with these levels. It is necessary to study them well before making any final step in the stock market.
In these levels, there’s nothing like 100% certain. There are chances that the price of the shares can break the levels and not obey them. Another con of these levels is that there can be a spike or false break.
It is a bit difficult to know about the exact support and resistance levels. If this level is known then can help in various trading strategies. The investors need to be vigilant and careful when the price of the share is carried slowly close to any support or resistance level.
In terms of volatility in stock prices, there are chances of a high degree of volatility which can be easily guided by support and resistance amongst many others. In other words, these levels can help in demonstrating the chances of buying or selling.
Support and resistance – Conclusion
It can be concluded that Support and resistance is basically a point where the forces of supply and demand meet together in the stock market. As the supply increases, prices decline and demand increases, prices advance.
For the technical analysis, these levels play an important role. This level has a great risk to reward ratio. If anyone is aware of the existence and location of the levels then it can help in enhancing the technical analysis and also the forecasting abilities to the stock market.
Along with this, there are some concerns associated with these levels that need to be focused as well before you start using them in your trades.
In case you are looking to get started with stock market trading or investments in general, let us assist you right away!
For more information on Share Market Research, here are some reference tutorials for you:
Summary
Reviewer
A Digital Blogger
Date
Broker Name
Support and Resistance
Overall Rating
