


Looking for Low Brokerage, High Margin & Free Tips?
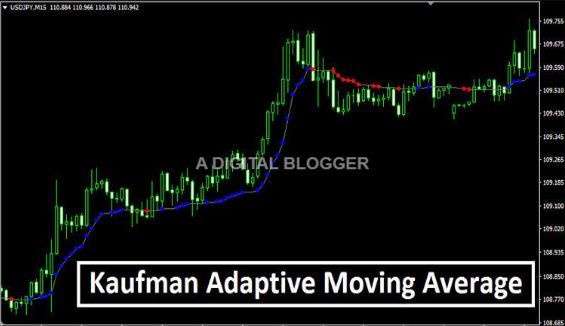
Kaufman Adaptive Moving Average
More On Technical Indicators
Kaufman Adaptive Moving Average is shortly known as KAMA, developed by Perry Kaufman It is used to calculate the moving averages for studying the market volatility. Perry Kaufman is a US-based quantitative financial theorist, a US system trader, an expert in developing computerized trading programs.
KAMA will precisely observe the price fluctuations, especially when the price variations are relatively minor with low volatility. It will adapt when the price fluctuates and follow prices from a safe distance. In simpler terms, it will keep monitoring the price movements and trends for you and notify you on market fluctuations.
It is one of the most popular technical indicators which can identify the overall trend, time turning spots with refining price strategies. The Moving Kaufman technology has been designed in such a way to work as a moving average, because of its adaptive features. Besides, it will track the speed of market volatility trends and adapt to the changes.
The adaptive quality lets the system automatically make changes in its speed according to market volatility. Thereby it offers greater user control. When the noise is low, it follows the price closely and smoothens out the volatility at the time of price fluctuation.
Contrary to this, if the market sticks on the range, it will be dominated by bars which will smooth out the moving average with a more extended lookback period and thus will avoid false signals.
Kaufman Adaptive Moving Average Performance:
Kaufman Adaptive Moving Average has undergone many upgrades in recent years. It is known as one of the best Moving Average indicators due to its excellent capacity to adapt to the Forex trading charts. These Forex trading charts developed on price action changes.
The Moving Average indicator can be applied to all types of timeframe charts as well as with Forex currency charts. It has maintained an excellent record over the years with its outstanding performance.
The Kaufman Adaptive indicator works similarly like other moving averages. The highlighted feature of Kaufman Adaptive indicators is that it observes the nature of market momentum and adapts itself with the change to mark both trend and trade signals.
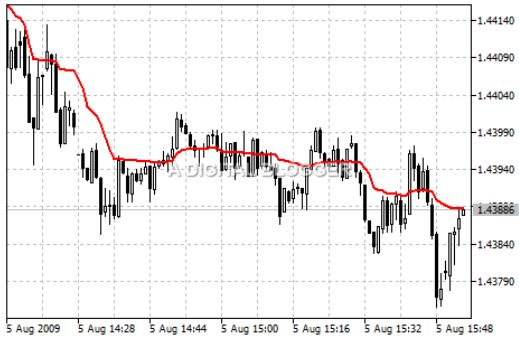
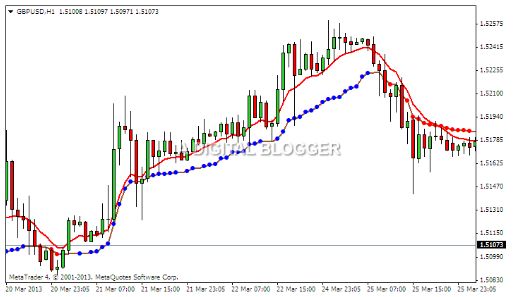
It changes into blue colour when price holds it positions above its level to signal the bullish trend. If the market is in sideways, it moves as a horizontal line. It changes to red and moves downwards with price closing below and this level is interpreted as the bearish trend.
Adaptive Moving Average can be used to develop a moving average that shows low reactivity against price noises and can be applied for trend detection with a minimal lag.
Kaufman Adaptive Moving indicator is one of the most widely used moving average indicators.
Like any other moving average indicators, the Kaufman Adaptive Moving indicator smoothens the market noises and shows the market trends more clearly. The moving average indicators filter out the noises, to reach the goal by averaging the price values of the periods, by computation. During this process, some additional weight gets added to the average prices.
With Kaufman Adaptive Moving Average indicator’s calculation, every particular price receives a different weight increment adapted to the current market trend. When the market prices are gradually moving towards a specific direction, where there is a trend, the indicator becomes more sensitive and adds a heavier weight increment to the price computation.
When the price is not stable, the indicators become less reactive and adds lighter weight increment to the price.
We can present the facts in a different way that the indicator works well when there is a steady trend. Also, if the price movement is unstable, it reacts to the market fluctuations that produces less fallacious signals.
The Kaufman Adaptive Moving Average can consider as an advanced version of Volatility Index Adaptive Average, which in short calling as VIDYA. In VIDYA, it uses Efficiency Ratio for identifying the trends of ranging price and moving average trends.
However, the difference between KAMA and VIDYA is that in KAMA user will have the freedom to determine the high and low smoothing limit.
Both Kaufman Adaptive Moving Average and VIDYA are identical in nature and are smart enough to adjust as per the price trends by applying Efficiency Ration Indicator. During ranging and weak trends, KAMA increases EMA’s smoothing automatically.
But in the meantime, EMA’a smoothing will get reduced during strong trends. Because of this reason, traders choose KAMA over other traditional trends.
Even though we consider Kaufman Adaptive Moving Average is a better choice than EMA, it stays less popular than traditional EMA as it is relatively not a developed technical indicator.
Trading Using Kaufman Adaptive Moving Average:
For calculating Kaufman’s Adaptive Moving Averages, we need to adopt distinctive measures. We can follow 2, 10, and 30 setting as suggested by Perry Kaufman to find the moving averages.
- For finding the Efficiency ratio, set the number of days at 10.
- For finding the fastest EMA constant, set the number at 2 periods.
- For finding the slowest EMA constant, set the number of days at 30
It is paramount to calculate the ER (Efficiency Ratio) and the SC (Smoothing Constant) before calculating the Kaufman Adaptive Moving Average.
ER denotes the price fluctuations marked to identify the daily volatility. The calculation is as follows:
ER (Efficiency Ratio) = Change/Volatility
Change = Absolute Value (ABS) (close-close (10 periods ago))
Volatility = Sum10 (sum of recent ten price changes) (ABS (close-prior close))
For finding the volatility, we can sum up the total amount of the recent ten price changes (close-prior close).
Where ABS stands for Absolute value.
With the ER and Smoothing Constant, it is easy to calculate Kaufman’s Adaptive Moving Averages.
Current KAMA = Prior KAMA + SC x (price-prior KAMA)
As the trading rule suggests,
- Buy when the AMA turns up
- Sell when the AMA turns down
Kaufman’s Adaptive Moving Average is an intelligent moving average tool developed on the EMA (Exponential Moving Average), which is responsive to trend volatility. It follows the prices when the price fluctuations are insignificant, and the noise is low.
KAMA will automatically adjust when the prices fluctuate in large scale and follow the prices keeping a safe distance. Like other moving averages, KAMA can use to visualize the trend, understand price movements and time fluctuation points.
The Kaufman Adaptive Moving Average indicator is commonly using to build moving averages that have low reactivity to price series noises, and the minimal lag characterizes it for trend detection as smart trading.
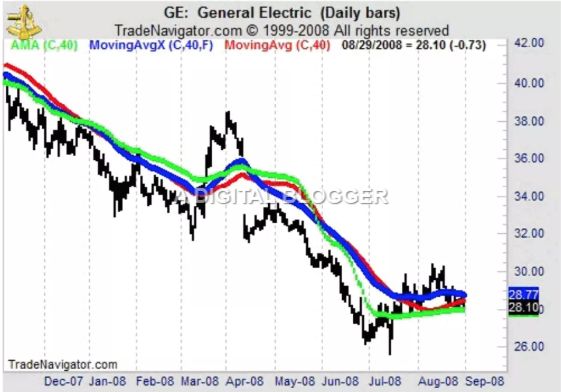
Kaufman Adaptive Moving Average Example:
In the chart below on Moving averages, the AMA is in green colour indicates the highest degree of flattening in the range-rich action seen on the right side of the chart.
In majority cases, the exponential moving average appears in the blue line, which reflects very close to the price developments. The red line reflects the simple moving averages. The three moving averages shown in the above chart indicates the trade fluctuations at various times.
On the stock chart below, we can see the example of the simple trading system based on crossovers of two Kaufman Adaptive Moving Averages. We can find, during a bumpy market trend, the system effectively eludes trading at the top.
If we use exponential Moving Average instead of Kaufman Adaptive Moving Average, you will have many negative signals during the price side-way trend, or you would have stayed idle, and the signs will be generating at the better place.
Basically, when the market is trending strongly, there are only minor counter trends with less noise. On the other hand, if the market is range related dominated by bars, we may prefer moving average with a more extended lookback period that will smooth out and thus prevent false signals.
Kaufman Adaptive Moving Average Strengths:
Here are some of the benefits of using Kaufman Adaptive Moving Averages:
- In Moving Averages, it calculates the average data for many days, and one can arrive a sort of automated trend line that highlights the trend.
- The Adaptive Moving Average moves relatively slow when markets trend sideways but move swiftly when the market accelerate fast.
- Automatically change direction when there is a break out of trading range.
- Adaptive Moving Average automatically adapts to the market volatility.
- AMA traverse between fast and slow moving averages.
- AMA is designed in such a way that it moves slower in sideways trend market and also faster in a trending market.
- Kaufman moving average is designed for market noise identification.
- The KMA can use as a tool to filter the price movements, pinpoint the overall market trend and time turning points.
- The KAMA will adjust when the price swings and monitors the prices from far away.
Kaufman Adaptive Moving Average Weaknesses:
At the same time, here are a few concerns of using this technical indicator in your trading:
- There is a market noise when the market is unstable in a sideways trending market
- While smoothing the data, moving averages tend to lag behind the market action and the trader has to give back the large sum of earned profit.
Kaufman Adaptive Moving Average Conclusion:
From the above review, we can understand that the Kaufman Adaptive Moving Average is an intriguing new concept with the right amount of intellectual appeal. You will gain the knowledge only through practical application on this complex trend smoothing method.
It emphasizes that the Adaptive Moving Average should be combined with other indicators to develop a profitable trading system in the coming days.
The Efficiency Ratio can be used as a stand-alone trend indicator to locate the most profitable trading opportunities. So, choose the ratios above 0.30 for receiving strong uptrends for profits and strengthens your position for possible trading.
Also, Kaufman Adaptive Moving Average is ideal to use as an alternative for ordinary moving averages, and it has more dynamic features than other indicators and imparts greater user control.
In case you are looking to get started with using such technical indicators or generic stock market investments, let us assist you in taking the next steps ahead:
Summary
Reviewer
A Digital Blogger
Date
Broker Name
Kaufman Adaptive Moving Average
Overall Rating

One Comment
good, thanks!