


Looking for Low Brokerage, High Margin & Free Tips?
Best Indicators for Positional Trading
More On Technical Indicators
As a trader, you must have heard of the term positional trading in the share market! However, did you try practicing it? If you’re thinking so, then we’ve got a list of the best indicators for positional trading, that will help you kick start your journey and earn good profits.
Best Technical Indicators for Positional Trading
Technical analysis of a stock helps in identifying the current movement of the share and also helps in evaluating its performance in the near future.
Since positional trading is done with the major objective of earning the best profit from the trade, it becomes even more important for positional traders to do the right analysis before trading.
So apart from the positional trading strategies, one must grab enough information on the indicators for positional trading that further help them to book their profit at the right value.
No doubt the technical indicators are helpful in the price point to enter and exit the trade.
But what is more essential is to know what are the best indicators for positional trading and how to use them to get the right information.
In this review, we’ll talk about:
- Support and Resistance
- EMA
- Fibonacci Retracement
- Stochastic RSI
So let’s dive in to know how to use these indicators for positional trading.
Coming to our first and most popular one, The Support and Resistance!
1. Support and Resistance
Support in real life is “to hold up”. Which can also be applied to trading in the stock market. Here as we talk about the share price of a stock, support is something that doesn’t let the share price drop any lower.
Isn’t it mesmerizing, how easy it becomes when you know the probable lower price at which you can make your entry into the trend and avail the fruitful benefits of the same? Yes, this is the advantage of support as an indicator.
This offers the position traders an opportunity to plan entry in the upward trend to go long accordingly. So comes the opposite of Support which is “Resistance”.
While resistance means “confrontation”, in trading this word means a barrier that does not let the share price go any bullish. Acts as a stoppage indicating a bearish trend or the dip in the future.
Basically, position traders use resistance to indicate the probable higher price at which they can go short and earn greater profits.
Support and resistance together are considered as most prominent indicators for positional trading. These two forms the base of any strategy that the trader uses, especially the position trader.
General-purpose of these two is to plan entry and exit from the underlying trend of the stock be it bullish or bearish. Since position traders are trend followers, short-term price fluctuations hardly matter to them.
We can understand the concept with the help of an example,
If you love sports then Tennis can be a great game to relate to. Two players on either side try to hit the ball to avoid any boundaries. Let us consider the left player as the support and the right one as the resistance.
Both will act as barriers; one will stop the price from rising any further indicating the right time to make an exit, while the other will stop the price from falling indicating the right time to plan the entry in the underlying trend.
And as we move further in the list we have;
2. EMA
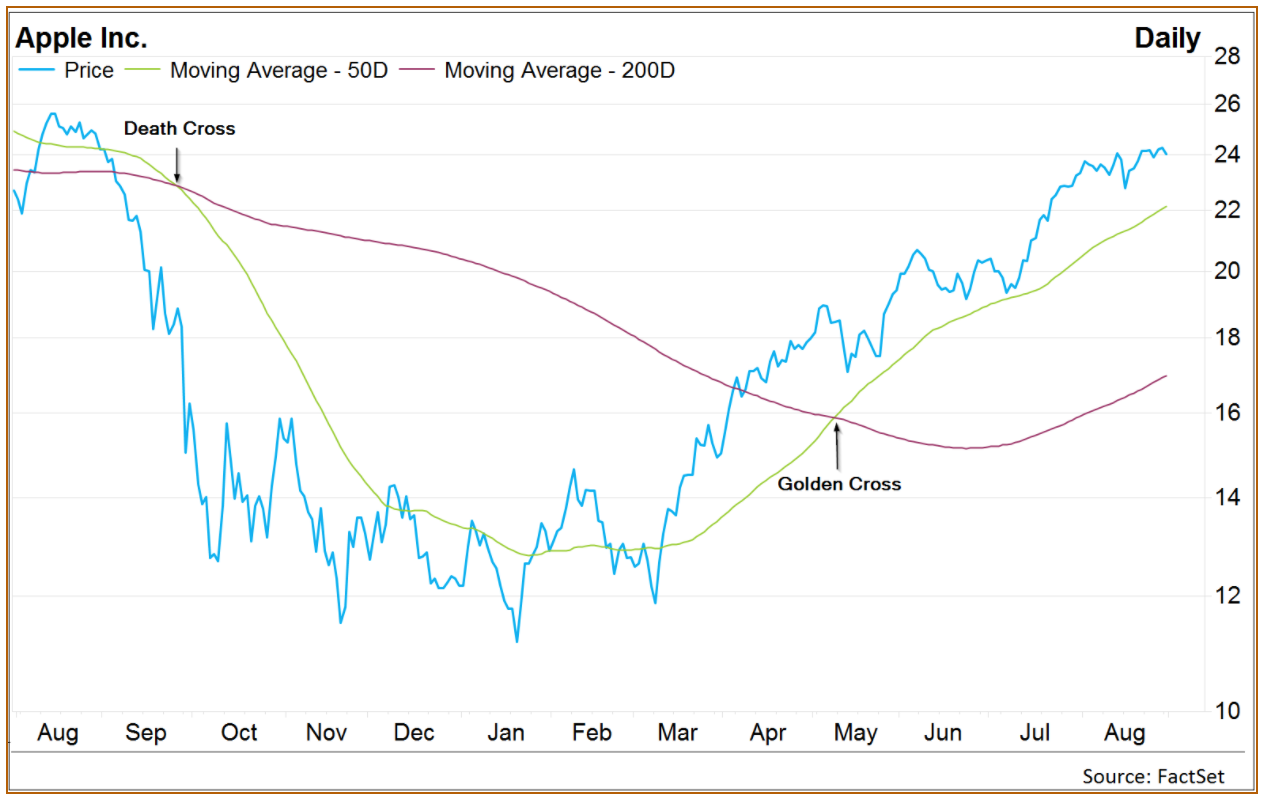
Well, you all must have heard about the ideal 50 days and 200 days EMA strategy in positional trading. This is all about the crossovers of the two MA lines.
50 day MA is considered the most accurate trend indicator. In a consistent uptrend, it is said that the price usually stays above the 50 day MA line. It uses historical data to analyze the probable trend of the future.
Coming to the crossover of the two MA lines. Usually, entry or exit opportunities are formed when the two MA lines cross each other.
So when the fast-moving average crosses the slow MA line from below, “Golden Cross” is indicated showing a bullish trend while when the crossover happens from above, it is called “Death cross”, thus showing the bearish trend.
But there are certain issues that the traders here face, by the time crossover is indicated, the price fluctuates and the EMA line moves, thus offering minimal time to plan or make decisions, hence to eliminate this problem,
Yet another indicator is used, the RSI, this helps the investor in identifying the golden cross even before it happens. Isn’t that amazing? You as an investor can predict the fluctuation and completely feel like an astrologer.
In the end, together when the two are applied, they form a deadly combo, to accurately point out a price at which you can act upon. Usually, that point occurs when the price is above 200 MA line with RSI over 20.
Moving on!
3. Fibonacci Retracement
Prior to understanding the Fibonacci Retracement, it is important to know about the Fibonacci Series. Just like the name, the concept is also unique and interesting to learn.
Fibonacci is the series of numbers in which any number is the sum of the previous two numbers. Since it is a whole number series, this starts from 0 but there is no ending to it. Hence can be said that the Fibonacci series goes till infinity.
As an example we can see the below series,
0,1, 1,2,3,5,8,13,21, so on.
Also, an important thing here is that, when you divide any number with the previous number, the ratio always turns out to be approximately 1.618.
Example,
8/5= 1.6 or
21/13= 1.615
This 1.618 is known as the Golden ratio or Phi.
Wanna know a hidden fact? Fibonacci numbers can be found in nature, like fruits, vegetables, branches of trees, number of flower petals, etc.
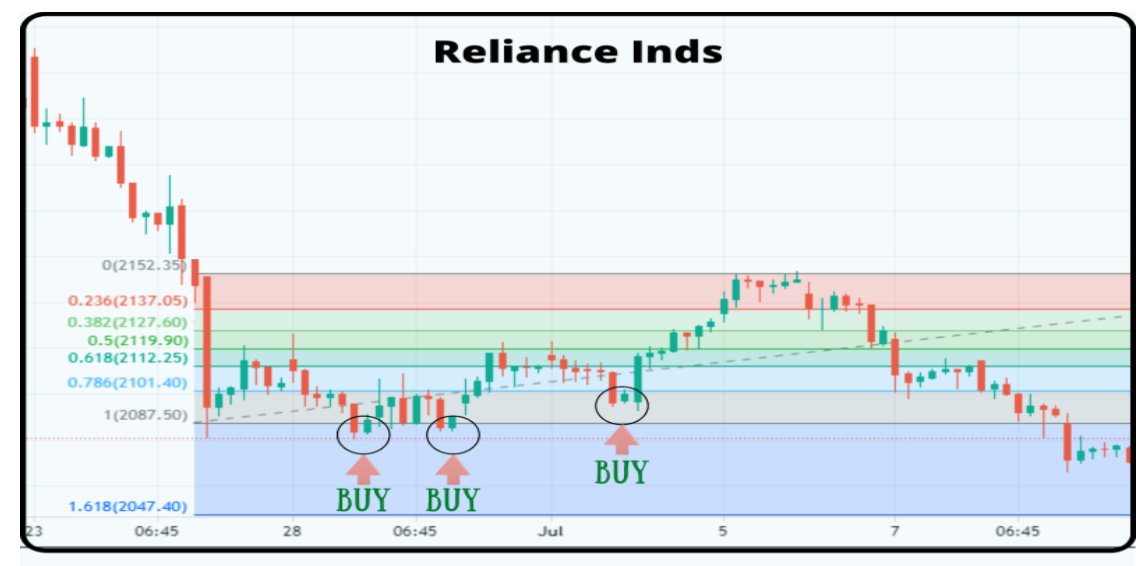
Thus it is believed that the ratios 61.8%, 38.2% and 23.6% can be used when there is a noticeable price fluctuation in the chart.
This basically is used in the “Pullback and Retracement strategy” while trading positions.
For example, if a stock price has moved to ₹20 from ₹10, so there are moments when the price drops to ₹15 before rising to ₹25.
Well, this gives you an idea of the retracement level at which you can grab the opportunity to enter the trend and open position.
Now let’s say, you see a price of ₹50 and then the price reaches up to ₹152. To apply Fibonacci, you define the up move on ₹102 which is the difference between the two prices. After which you as a trader can analyze the correction as per the ratios, 61.8%, 38.2% and 23.6%.
The first possible correction can be at 23.6% level and further, it moves to 38.2%, then 61.8%. But how do you know the price to make entry, this can be calculated as,
Fibonacci up move: ₹102
23.6% * 102 = 24.07
Hence retracement will be;
152-24.07= ₹127.93
Similarly, the retracement can be calculated for the other ratios and thus, choose the best time to open the position. Similarly, you can see the chart below of “reliance Inds.”
Accordingly one can plant their entry point to open a position in the underlying trend.
4. Stochastic RSI
Before you get into Stochastic RSI, it becomes important for all to understand the term RSI.
To keep it simple RSI is the indicator for technical analysis of stocks used to analyze the stock or any other asset’s price momentum be it bearish or bullish for that matter.
Well, it is said that the stochastic RSI is the combination of RSI and Stochastic Oscillator. And that it fluctuates between 0 and 1. In general, we make use of this indicator to identify the overbought and oversold situations.
It is said that the readings below 0.2 are considered oversold and the reading above 0.8 is seen as the overbought situation in the chart. Here oversold instances are seen to hint at the bullish trend while if an overbought situation is seen in the long downtrend, it is seen as the bearish trend.
However one should be smart enough to avoid entry following the overbought or oversold situations until the price fluctuation confirms the action.
But how do we calculate the Stochastic RSI?
Let’s try to understand it with the help of an example.
Suppose a stock, say Apple Inc. has been experiencing a downtrend for the past 3-4 weeks. Reflecting RSI values between 19 and 52 while the current reading shows 49. Hence the StochRSI for the stock will be calculated as:
(49-19)/(52-19)
=30/33
=0.9
As discussed earlier, this value shows the overbought situation. Meaning there are high chances that the trend will continue its fall after slight bullish fluctuation.
However, once it falls below 0.5 it can be an opportunity to enter a short position as per your trading needs.
Technical Analysis Books
Now the above indicators can be difficult to understand for a beginner trader. Right?
Well, there is no doubt that they are. Moreover, when it comes to the practical usage of these indicators it becomes even more challenging for a trader to take the right decision on the basis of the trading signals it generates.
To simplify the complexities, it is, therefore, good to consider some of the books that are written with an objective to simplify the difficult and complex concepts.
There are many available books there are many but to pick the right and best one, here are some of the suggestions below:
1. Technical Analysis Explained by Martin J. Pring
Here are some of the major concepts covered in the book:
- The author explained what major factors to be considered when trading in the market.
- Also, it covers the psychological aspects that help a trader in earning and maximizing the profit in the share market.
- You can find some of the easiest and most useful profit-making strategies in the book.
2. Technical analysis by Charles D. Kirkpatrick II, Julie R. Dahlquist
Another book on technical analysis that helps traders in understanding:
- The risk associated with trade and its management.
- Different indicators useful for trade
- Candlestick charts, their pattern and recognition techniques.
3. How to Make Money Using Candlestick Charts by Balkrishna M Sadekar
The book by an Indian author, covers examples and strategies that can help a trader to reap benefits from short-term trades in the Indian market.
- The book teaches the practical usage of tools and techniques of market analysis.
- How emotions can impact the trade and what are the ways to keep them away.
- The simple way of doing market analysis using chart patterns and indicators.
Conclusion
Finally, now that you know about the mentioned indicators for positional trading, you are good to go, but there are certain pointers you need to keep in mind before entirely relying on these is that:
- Always consider your financial goals before opening a position.
- Since we’re talking about position trading, fundamental analysis of stock is quite important here.
- Also believing in just one indicator may lead to huge losses, so always use two or more indicators to confirm your move before acting.