


Looking for Low Brokerage, High Margin & Free Tips?
Parabolic SAR
More On Technical Indicators
Parabolic SAR or PSAR – What is it? How does it help you in your trades? Well, Parabolic SAR is a technical indicator used by traders to identify the trend direction and the likely reverse trend in the price. This indicator provides a price direction, which gives the required advantage for traders when it highlights the direction of the asset movement and also indicates the best exit and entry points.
What else do you need to reap in profits, right?
Generally speaking, technical indicators use a combination of information based on volume, price, open interest calculation of contract or securities, projected in such a way to offer exact/possible trend of trade.
Based on this reading, and subsequent analysis of historical data, a chart created by projecting the possible future price movements. Some of the leading technical data indicators are Stochastics, Money Flow Index, Relative Strength Index, Bollinger Bands, and MACD.
Parabolic SAR Indicator
Parabolic SAR indicator, sometimes also known as Stop and Reversal system, developed by J. Welles Wilder Jr, gives many insights into the movement of prices. Even though a mechanical engineer by profession, Welles Wilder made several contributions for technical analysis and some of his great technical indicator tools are Average True Range, Relative Strength Index, Average Directional Index, and the Parabolic SAR or PSAR.
The Parabolic SAR indicator adapts unique trailing stop and reverse method, which reflects in short form as SAR, pinpoints the possible exit and entry points helping a trader to take the right decision.
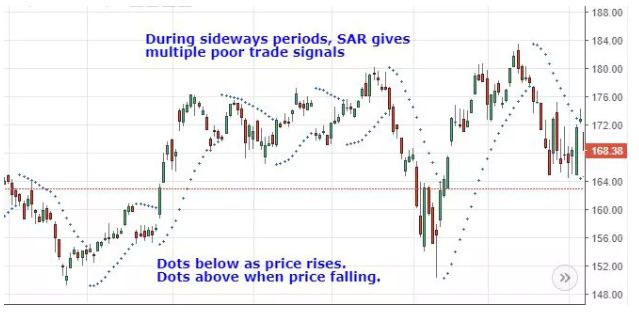
The following chart will give a physical illustration, how the SAR indicator gets projected. You can find a series of dots placed on any side of asset’s price, which denotes as the SAR indicator and this may appear as per the direction of the price movement.
Analyzing Parabolic SAR is a quite simple process, like any other indicators; in fact, we can see it as much easier. When the price is trending upwards, the dot will appear below the price and when the price is trending downwards the dot will appear above price.
Simple, isn’t it?
Parabolic SAR Explained
Here are a few quick notes on how Parabolic SAR indicator works:
- A dot below the price indicates an upward price movement.
- A dot above the price indicates downward price movement.
- Price will always rise when the dot is below the price.
- Price will always go down when the dot appears above the price.
- For every price bar, you can find a dot. So evidently there will be continuous information about the price changes.
- The appearance of dots will help the trader to track the price movements effectively, and to watch the price reversal when it happens.
- The dots appear to flip when the reversal happens. When the price register below the rising dots, then the dots will take a position above the price, which is a warning to indicate an impending downtrend.
- However, it is important to note that a chart reversal indicator does not imply to warn that there is an impending price reverse. The Parabolic SAR chart only indicates that the price and indicator have crossed its position, which will help seasoned traders to take corrective measures.
Parabolic SAR Formula:
Rising Parabolic SAR = Prior PSAR + [Prior AF (Prior EP-Prior PSAR)]
Falling Parabolic SAR= Prior PSAR – [Prior AF (Prior PSAR – Prior EP)]
In the above formula, AF stands for Acceleration Factor. It begins at 0.02 and ascends by 0.02 and continues to increase to a maximum of 0.2. Each time the extreme point registers a new low or high, which is falling SAR or rising SAR respectively.
Similarly, the EP represents Extreme Point. It denoted the bottom low in the current downtrend or maximum high in the current uptrend, which is falling SAR or rising SAR respectively.
Parabolic SAR Calculation
You need to use both formulae according to the price trend situation. When the price trend is down, you need to use the falling SAR formula, and when the price shows an uptrend, then you need to use the rising SAR formula.
Apart from the above basics, there are many other technics also in use to calculate the Parabolic SAR indicator.
Follow these techniques:
- Continuously observe the price and record high and low for a minimum of five periods or even more.
- When you see an upward trend, for marking the Prior PSAR value in the formula use the bottom low of the five periods. Similarly, if you see a downward trend in the price, then use the highest price of the high, which has recorded within the five periods as the initial Prior PSAR value.
- Set the initial AF value as 0.02 and increase it by 0.02 for each new extreme high (rising) or low (falling). The value for maximum Acceleration Factor is 0.2.
- It would be better to use a spreadsheet to register the high and low price, SAR, AF, and EP, where you can track the changed step by step as per the period of changes.
By using a charting software, you can get the Parabolic SAR automatically. However, you should have the precise knowledge of using the indicators intelligently.
Parabolic SAR Signals
As mentioned above, in Parabolic SAR the indicator dots appear either side of the price bars, i.e., above or below. When the dot appears below the price, it can consider as a bullish trend, and when it appears above the price bar, we can assume it as bearish.
When the trend appears either bullish or bearish, it may likely to continue the trend and indicates possible development on the course and based on this reading; a trader can prepare to take proper trade planning.
When the stock price rises, the dots will also rise at a slow rate and increase its upward momentum according to the trend. While the trend develops, the SAR begins to move a bit faster, and dots start moving to match to the phase.
In the above-referred chart, the indicators precisely chase the trend helping to reap benefit or to take an appropriate decision, but the signals can also give a wrong indication if the prices move sideways or if the trading happens in a shaky market.
As a trader, you can expect more loss or little profits when the price moves sideways. When the price rises, the indicator can help the trader to stay in the trade.
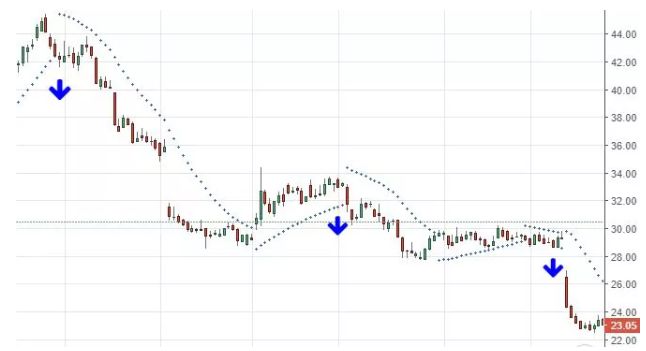
In the next chart given below, which shows a downtrend, the indicator will help the trader to focus on a short trade until the trade starts to show an upward trend.
Parabolic SAR Stop Loss
You can use the Parabolic SAR for setting stop-loss orders. By merely moving the parabolic SAR indicator matching to the stop-loss, you can activate the stop-loss orders. As you know, stop-loss orders help to limit the possible loss of an investor with the prices falls below to the set position of security.
The stop-loss can use for long term position as well as short term position. So, you can use the stop-loss orders for both long term and short position by matching to the level of PSAR indicator after every price position.
The Parabolic SAR indicator will keep on changing, since it is a mechanical feature, as per the changes in the price position and radiate a new signal on long – and short-term trends. An experienced trader can take the call by reading through the trends.
As part of safe trade practice, it would be better to focus on short sales during a downtrend as you can see in the above-given chart, instead of focusing on the buy signals.
Parabolic SAR strategy
As a general rule, it would always be better to engage with several indicators rather than focusing on a single indicator for better favourable trade result. Parabolic SAR can sync effectively with ADX or Stochastic or Moving Average for better trading signals.
By analyzing SAR indicators, you can find the sell signals will be very much accurate when the price of trading shows downtrend comparing to the long-term moving average.
An experienced trader can catch the PSAR signal precisely because a downtrend price indication on a long-term moving average can be the beginning of a continued downtrend.
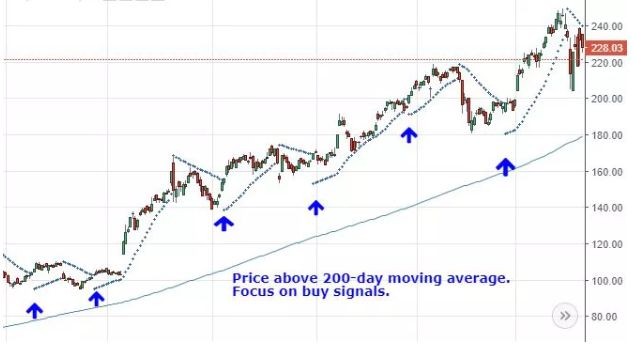
Similarly, you can keep the focus on the buy signals, when you see the price appears above the moving average. Even though you can use the stop-loss orders, you don’t have to opt the option since the long-trend shows an upward movement.
Parabolic SAR Conclusion:
Parabolic SAR is a useful indicator for understanding the movement of the stock and setting stop-loss orders. You can set the stop-loss orders on downtrend and uptrend movements. But it has a negative point which is very much disappointing.
It gives wrong signals when the stock starts moving sideways and will be a reason for losing trades. With the help of moving average tools, you can overcome the shortfall of false signals.
The Parabolic SAR can be used for multiple trades. Many traders and experts using PSAR say that by using moving average alone can help to capture the entire uptrend of the trade without the help of PSAR. Hence, many have the opinion that PSAR can give a better result for traders who focus on the high-momentum move.
However, using PSAR will not diminish the scope of having a better understanding of trade trends and set your winning parameters.
When used along with other technical tools, Parabolic SAR is a winner for providing precise price indication. Further to avoid any possible miscalculation, as a safe trade practice, always trade in the direction of the trend.
For this very purpose, PSAR is a useful tool to gauge the tendency of the price movement.
In case you are looking to get started with stock market trading or investments in general, let us assist you in reaching a totally tech-savvy broker with some of the top-notch trading platforms:
Summary
Reviewer
A Digital Blogger
Date
Broker Name
Parabolic SAR
Overall Rating
