


Looking for Low Brokerage, High Margin & Free Tips?
Candlestick Chart Types
| | Charts | No Comments
More on Charts
When it comes to technical analysis, understanding candlestick chart types becomes crucial as it helps analyze the price and volume of trade of a particular stock.
In this article, we will discuss different types of
candlestick chart that further helps you pick the right stock to trade.
But before stepping over to the candlestick chart types, let us know a bit about the meaning of the candlestick chart.
Candlestick chart originated from Japan in the 1700s and is a type of chart used in technical analysis representing the high, low, open, and closing price of a security for a while.
When the candle goes up, it is colored green, and if it goes down, it is colored red.
Let’s understand this with the help of an example!
Let’s assume the first trade of the day begins at Rs.7,000 (which is the opening price) and then move around until the last trade of the day closed at Rs.8,000. This was an Rs.1,000 price increase, which will make it a green candle.
And if the opening price is Rs.8,000 and the closing price is Rs.7,000, it makes the red candle as it shows the Rs.1,000 price decrease.
Candles can be set to represent a single day, a month, or even a single minute. They don’t have to be set at a certain period of time.
Now, we will discuss the types of candlestick chart.!
Types of Candlestick Charts in Technical Analysis
In this segment, you will get to know the different types of candlestick charts in technical analysis of a stock. After that, you will be able to identify these kinds of candles to spot market trends.
Here are some of the significant types of candlestick charts that will help analyze the chart and then understand the various patterns.
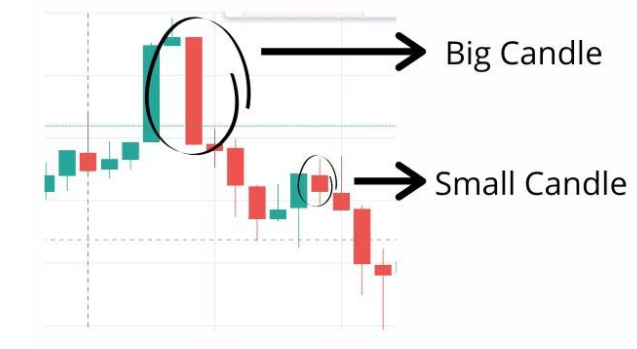
Big Candles
Big candles explain themselves very well as it indicates the significant price difference. This segment consists of two candles, big candles, and small candles.
For example, the small candle might have a drop of Rs.100, where the big candle has a drop of Rs.300. The big candle is for the drastic change in the price, whether it is increasing or decreasing.
Note: A candle will tell you about the latest supply and demand during the lifespan of it.
A candle that will decrease in price means the supply was higher than the demand during that time and a candle that will increase in price means the demand was higher than supply at that period of time.
Dojis
A Doji is a type of candle in which the fluctuation in price during a certain period of time but open and close at the same price. That certain period could be of one day, one hour, or even for one minute.
This type also tells you that the stock market is very much unstable or uncertain.
Dojis tell you that there is hesitation on the price but doesn’t tell anything else. Further, there are two types of Dojis:
- Morning Doji Star
- Evening Doji Star
If the candles are moving down, hit a Doji, and begin to move up, it would be known as Morning Doji star. And the opposite pattern where the Doji mark the trend reversal going down then would be known as the Evening Doji star.
But both of these won’t tell you what stock you should purchase. And if you have already chosen the stock, this approach will help you with the best time to enter the market.
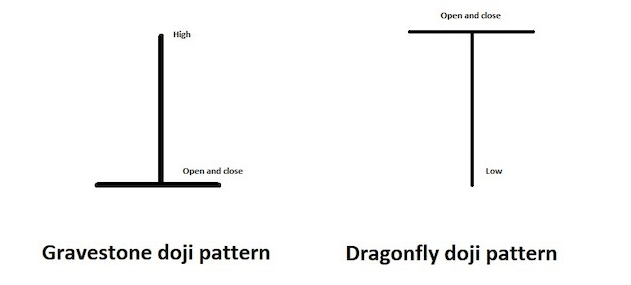
Gravestone and Dragonfly: These two types of candles only fluctuate in one direction, either increasing or decreasing. Both of these have opposing implications.
Dragonfly is bullish, and the Gravestone is bearish. Though these alone won’t help, use them with another form to analyze the particular stock’s future trend.
If we talk about Gravestone and Dragonfly’s formation, both of these are very simple information and very easy to identify.
Both Dragonfly and Gravestone don’t have a body. The Dragonfly has a long lower tail but no upper tail, and it looks like the capital letter T.
And if we talk about the Gravestone formation, it has an upper tail but no lower tail, and it looks like an upside-down capital letter T.
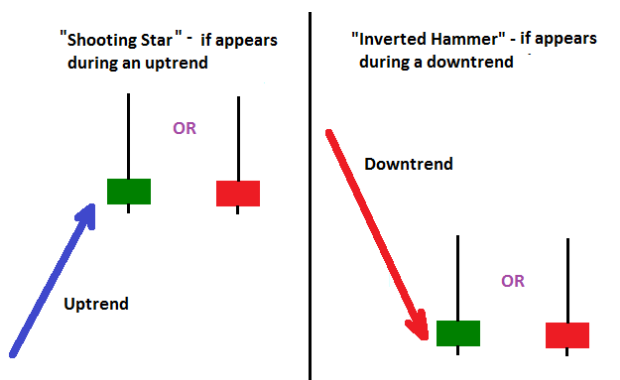
Shooting Star and Hammer: A shooting star is where the stock opens at a price, goes up, and goes down to close where it opened.
It is similar to the gravestone, and the Hammer is where the price opens and then goes down a bit and closes just below the opening price.
The hammer candlestick is mainly a bottom reversal pattern, whereas the shooting star is a reversal pattern.
The main difference between the shooting star and the hammer star is that the hammer is a bullish reversal pattern, while the shooting star is a bearish reversal pattern.
Technical Analysis Books
Above are some of the candlestick patterns that help a trader in determining the trend. For a more detailed understanding of the topic, you can read some of the technical analysis books that give you a wide understanding of the topic.
Here are some of the books that you can refer to understand candlestick patterns;
1. Japanese Candlestick Charting Techniques by Steve Nison
The book detailed information on what candlestick charts are, how they are useful in analyzing the market, and different patterns used to study the market are explained in detail in this book.
The author tried to summarize the complete concepts of candlestick chart analysis in the book that helps a beginner trader like you in understanding in-depth concepts of the market.
2. Technical Analysis of Financial Markets by John J. Murphy
Another book on the financial market, where you can learn about indicators, chart patterns, strategies, and lots more. The information in the book is provided in the simplest language making it easier for any trader to understand the difficult concepts of the market.
Not only the patterns and recognition, the book also discusses about the importance of time frame in technical analysis and in choosing the stock for trading.
3. How to Make Money Trading With Candlestick Charts, By Balkrishna M Sadekar
The book by an Indian author discusses the chart patterns and various related strategies in the context of the Indian share market. The author defines all the major and minor concepts that are useful for a beginner trader.
So whether you are an intraday or positional trader knowing these concepts and the practical importance of doing analysis in stock market will surely help you in earning profit in the stock market.
Conclusion
In the end, we can say that Candlestick Charts are very important whether you are into short term trade or long term investment, but you need to be patient to meet the investment goals.
The goal is not to memorize all these names but to understand how to make use of these candles to predict behavior when placed in a specific pattern.
Candlestick charts include the entry of big players with the amount of selling or buying of financial instruments according to the trend. This can vary from time to time.
In case you are looking to get started with stock market trading or investments in general, let us assist you in taking the next steps forward: