


Looking for Low Brokerage, High Margin & Free Tips?
Candlestick Charts
More on Online Share Trading
Are you an experienced trader, then you might be aware of the term Candlestick Charts?
For those who are fresher in the trading world, here is the information about the charts that can be used as a technical analysis tool.
No wonder, you can use Candlestick Charts to meet your investment goals and to invest in a smarter way.
Here is how different traders can use them for meeting goals of the day to day trading activities.
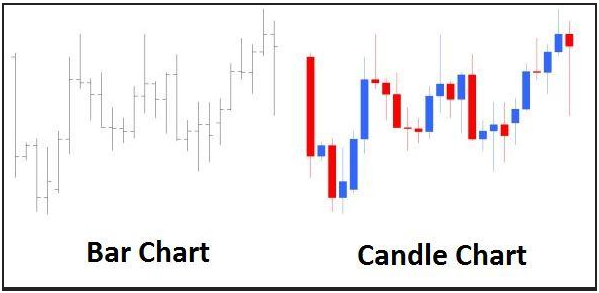
Candlestick Charts Explained
Candles give light in the darkness and candlestick charts give light for investors’ across the world.
Candlestick Charts are originated in Japan that is used to represent the size of price moves using different colors. These charts are very helpful to traders as it helps them to take a trading decision.
For more than three centuries even with the latest technological developments in this world, the use of these Japanese charts determines the right strategy for the various price movements of the financial instruments.
The Japanese use of emotions in various colors is technically used as varied tiny rectangular tiny boxes resembling candles.
Each box or candlestick typically represents one day of trading activity of a particular trading instrument. Financial instruments are the backbone of any country and investing in them with the help of this chart could make anyone prosper by the profits from them.
Candlestick Chart Types
The Japanese way to represent the price action over the set period of time is known as Candlestick Charts.
It provides information on price movement that helps investors to invest in the right direction.
Here are some of the major types of Candlestick Charts that help in analyzing the chart and thus assist in understanding its different patterns.
1. Long Candlestick Charts: Long bodies of the candlestick depicts strong buying or selling pressure.
- Long White Candlesticks: The long white candlesticks show strong buying pressure. The long body that closes above the open, represents that price increased from open to close and buyers are aggressive.
- Long Black Candlesticks: This type represents the strong selling pressure. The long candlestick in which close is below the open represents falling in price making sellers aggressive.
2. Short Candlestick Charts: The short candlestick charts are helpful to indicate the buying or selling activity.
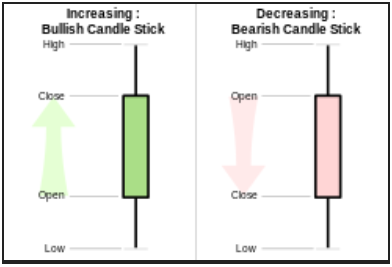
3. Bullish Candle: The condition of the market when the close is higher than the open is represented by the bullish candle. Generally, it is represented by green or white color.
4. Bearish Candle: The market condition when the close is lower than the open. It is represented by red or black color.
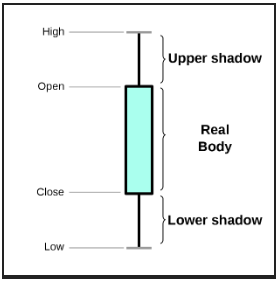
5. Shadow: Shadow represents one of the part that describes the candle.
- Upper Shadow: It is the vertical line present between the high of the day and close (bullish candle) or open (bearish candle).
- Lower Shadow: The vertical line that is present between the low of the day and open (bullish candle) or close (bearish candle).
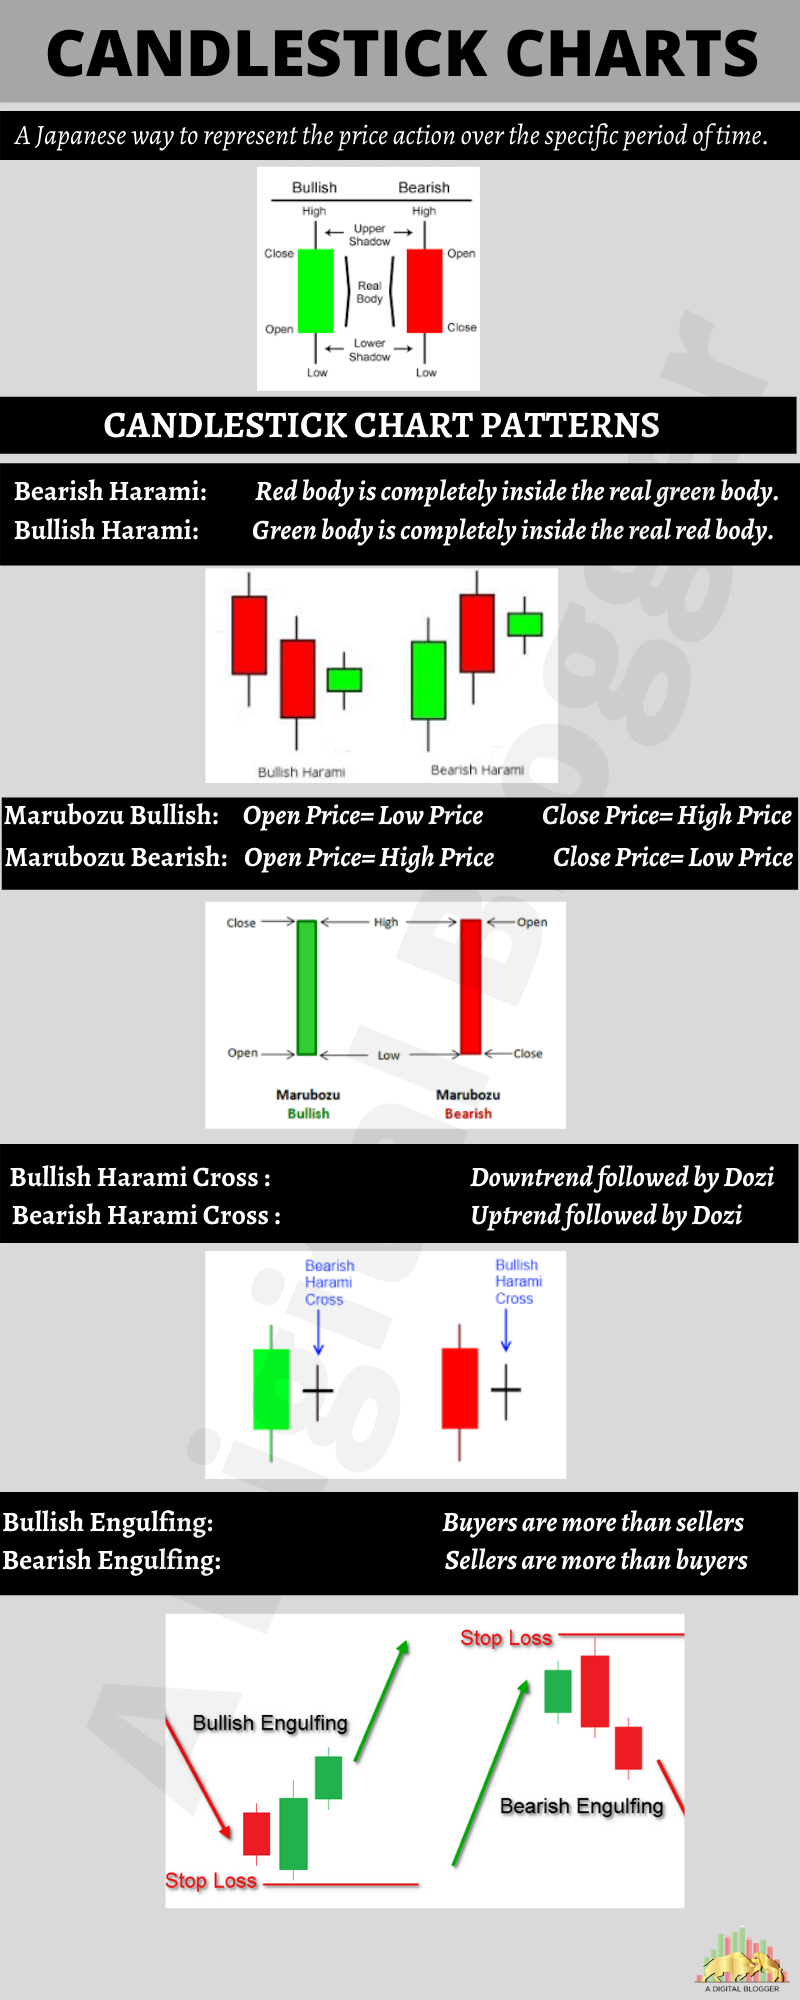
Candlestick Charts Patterns
Since the basis of creating the candlestick charts is the up and down movement in the price.
Although many times the price movement is random other times it forms certain patterns, that are helpful for traders to use it for analysis and trading.
There are different patterns for Bullish (represents the rise in price) and Bearish (represents the fall in price) market conditions.
These patterns go trending when the number of sellers is more than buyers. It is reflected by a long red real body engulfing a small green body.
This clearly indicates that the control of trading is in the seller’s hands and the price will continue to fall.
- Bearish Evening Star
This is represented by the topping pattern.
The identification mark of this pattern is the last candle in the pattern that opens below the small real body (either red or green) of the previous day.
The last candle closes deep into the real body that is two days old.
Thus, it displays the stalling of buyers and later control of the seller.
- Bearish Harami
It is the small red body that is completely inside the real body of the previous day.
It generally represents the indecision on the part of the buyers.
If the price moves higher, everything will be moved with the uptrend but the down candle in this pattern will indicate the further slide.
- Bearish Harami Cross
This generally occurs during an uptrend condition, when the candle is followed by Doji Star Bearish i.e the session when the candlestick virtually opens and closes equally.
This pattern is defined when the buyer outnumbers sellers. The chart is represented by a long green body engulfing a small red body.
Thus representing the price increase.
This chart represents the low open price of the day and the high close price. In simple terms, it represents the bullish market condition in which buying is done at every price of the session.
- Bullish Harami
It is the opposite of what is depicted by the Bearish Harami.
In this pattern, the small green body occurs inside the large red body of the previous day.
- Bullish Harami Cross
It occurs in a downtrend where the down candle followed by Doji. Here the Doji Star Bullish is within the real body of the previous day.
Candlestick Chart Analysis
Candlestick charts are used as technical tools for analyzing the price movements for any changes in the near future either for an upward swing or for a nosedive downwards.
Also, this strategy is employed by major financial institutions including mutual funds in all countries.
This is only a hypothetical technical analysis that determines the future behavior or pattern of a financial instrument like stock, currency, and derivatives as per their previous price movements for any period of time.
The candlestick or the bar could be described in terms of shape, solid or hollow, real and shadow and also with colors which include:
Shape
Each candlestick consists of a real body with the opening of the instrument at a specified time and its closing of it.
There are two wicks or line protruding on the upper end and the lower end of the real body.
The upper one represents the high price and the lower wick represents the low price of the specified period.
Here the period could be a minute to years. These two wick parts are called the shadows of the real body. The upper shadow and the lower shadow are towards the high and low of the period respectively.
Colour
The color of the candle depends on its previous close.
If the color is mainly white, blue or green it is trading higher than the previous close. And if the color of the candle is black or red in color it means it is trading below the previous close. These colors at any point in time determine the trading pattern of the instrument for that particular time compared with its previous close.
Body solid or hollow
The candlestick body determines the direction of the price at a particular point in time. If it is solid it represents a movement of price moving down from the open and a hollow means it is trading up from the open price.
Significance of Candlestick Analysis
The time period of the Candlestick varies and the various indicators of the charts like shape, color, shadow, real body, are there that help traders in determining the technical analysis of the price of any of the financial instruments.
You can reap the benefits of the Candlestick Chart in Trader terminal or mobile apps in IIFL Charts.
Candlestick Charts NSE
To understand candlestick charts better any instrument for a particular time period could be taken.
Let’s take an example of Nifty for a particular day trading.
Nifty is the National Stock Exchange (NSE) index which is the highest traded financial instrument in the country in terms of a number of trades and volume every day.
Here is how to study the candlestick charts NSE.
Lines
- The single line of the shadow above the real body indicates the top price at which it was traded for that particular day.
- The horizontal line of the candle is the opening price of the NIFTY for that day.
- The lower horizontal line of the box going towards downwards of the real body is the low price of the NIFTY on a particular day.
Color
- Other than the line the color represents the status of trading
- The White or Blue color represents that the trading is done at the price above the previous day.
- Black or Red represents the low price of trading as compared to the previous day.
Body
- The body is another important aspect that helps in analyzing trading.
- The solid-body represents that the trading is going lower from the previous price.
- The hollow body represents the rise in price from the previous day.
Candlestick Charts for Day Trading
The main advantage of the candlestick charts is to perform a technical analysis of the trends of the financial markets like stock, foreign exchange, commodity, derivatives and options markets and also for any particular financial instrument.
Just by visualizing the charts rather than confusing mathematical formulations and calculations one can arrive at the trend of the desired financial instrument. There are more advantages which include:
- You are not required to be professional in the field to understand the concept of candlestick charts, thus even you are new to the trading world, you can start investing smartly in the financial market by efficient use of candlestick charts.
- These charts use simple statistics by considering the data to day to day trading. Thus it only includes the data of previous day closing, current open rate, high and low of the day, and the closing price of the current day.
- Studying and analysis of these charts are also easy and one can interpret charts to come to a particular conclusion of trading.
- Moreover, the candlestick charts reflect the price movement that helps investors in determining the trends, breakouts and other authentic and accurate information than other methods used for stock market prediction.
A number of new techniques are built based on only the candles including the Fibonacci analysis, Heikin-Ashi candlesticks, and many more which are used for technical analysis of the markets.
The unique features of only the prices enable these candles of prices to be used for diversified or almost all financial markets.
These candles can be adopted by any kind of market activity which basically includes investing for the long term and short term, intraday trading, futures trading, Swing trading, hedge trading, and many more.
Thus, it is good to know about Swing Trading VS Day Trading and make decisions accordingly.
Candlestick Charts Online
Although Candlestick Charts are helpful to investors who are looking for the option to trade in real-time still there are many who face difficulty to use them effectively and to make the best use fo it for trading.
Some of the Candlestick Trading concerns are discussed below:
- Different Trends for Different Periods
The time frame is the basis of candlestick charts. The various time frames are used to define it as open, high, low, close for the particular period and the time corresponding to it.
But many times, the five minute periods of the chart will show one kind of trend and the 15-minute frame goes in the wrong direction.
This creates a lot of confusion especially for the traders who are freshers and have not gained much experience in the trading world.
In case you come across different trends for different time limits, then you can look for the alternative.
You can make candles for a specific volume of shares being traded. This helps you in getting a clear picture of the movement of the financial instrument for a substantial period of time and volume.
Hence the movement of the price above the normal average volume candle could be an ideal instrument for acquiring accurate trends of the financial instrument.
- Managing risks are difficult with candles
Since the candles are only based on the price movements of a particular period the entry and the stop loss could be determined only by the 4 levels of high, low, open and close.
This in many cases could be huge and if the stop-loss triggers it could be a huge risk of capital.
- Lagging indicators with candles
Since most of the entries are taken only at the close of a candle it becomes a lagging indicator.
Most of the action will be over within the candle and any new movement either side should accompany the volume.
Hence to lag behind and not to take the opportunity of the tide is another advantage of candles.
Candlestick Charts App
Candlestick charts are the graphical representation that helps in knowing the price movements in a given time period.
These charts are formed by defining the opening, high, low and closing prices of the financial instruments.
In all, the candlestick charts are used to draw various patterns that in turn is used to do the technical analysis thus assisting investors to invest strategically.
Here are some of the best apps that are used to get various stock information.
- Candlestick Charts: The android app that helps in visualizing the stock portfolio with financial charts.
- Trading with Candlestick Chart: This app is suitable for beginners who are willing to learn a trade with the Candlestick Charts. The app contains different videos that help you to learn the use of technical analysis eventually assisting you in doing trade.
- Professional Stock Chart: Another trade financial app meant for Android devices that help investors in tracking and technical analysis of stocks in the stock market.
Conclusion
Mostly the candlestick charts encompass the entry of the big players with their volume selling and buying of financial instruments to decide the trend. This could vary according to the time of the candle. And this could be only predicted for that period which could be contentious in certain cases.
Hence even with candlestick charts to trade or invest in financial markets, it is necessary to have patience, and discipline supported with the money which does not need an immediate return for any emergency purpose but for long-term use is a must.
Only with these and along with the centuries-old candlestick help to make anyone prosper and have a happy life.
In case you are looking to get started with stock market trading or investments in general, let us assist you in taking the next steps forward:
For more information about Online Share Trading, feel free to check the following content pieces:
Summary
Reviewer
A Digital Blogger
Date
Broker Name
Candlestick Charts
Overall Rating
