


Looking for Low Brokerage, High Margin & Free Tips?
Double Top Pattern
| | Chart Patterns | No Comments
More Chart Patterns
The Double top pattern is a bearish pattern that is formed after an uptrend and is associated with selling opportunities. The double top pattern falls under the category of reversal patterns and is characterized by tops or peaks that represent prices at a certain level. The reversal pattern generally forms at the end of trends and looks like an inverted W.
This level is assumed to possess a resistance which cannot be broken.
The pattern forms when a price reaches this target level and then returns back, only to re-bounce off and reach the same target level. These sorts of price dynamics give a double top on a candlestick chart.
Double Top Pattern Meaning
The formation of tops is definitely indicative of the fact that a strong move up has happened. The candlestick representation of a double top pattern also clearly shows how the second top did not break the high that was achieved by the first stop.
An experienced trader will know that a reversal is the next thing coming up in the market climate with buying pressure going down fast. Did you know that?
The two tops in the double top pattern are indicators of resistance in the market. From a different perspective, it means that the market tested the same resistance level twice and was rejected both times.
An important aspect of the double top pattern is to spot a close below the neckline. Simply spotting two tops at a specific level does not constitute a double top pattern.
Movement of price within a defined range is indicative of the breakout potential of a double top pattern, leading to volume expansion and improved price movement. The possibility of a breakout is both on the upside as well as the downside.
Similar to any other chart patterns, the best way to identify potential targets is to use price action as the key variable. To reconfirm the formation of a double top pattern, the trader may also estimate a potential market move once the formation of a double top pattern is spotted.
This type of estimate is called a measured move.
Two important concepts are connected to the estimation of a measured move.
These terms are the measured move and the measured objective.
The major objective refers to the level of a market at which it may be possible to obtain an increased level of sell or buy orders.
On the other hand, a measured move refers to the distance, measured in pips, starting from the pattern’s broken level to a specific future point. To put it in another way, the measured move is an estimation of distance, while the measured objective defines the exact target or level.
This pattern is seen as the exact opposite of the Double bottom pattern.
Double Top Pattern Trading
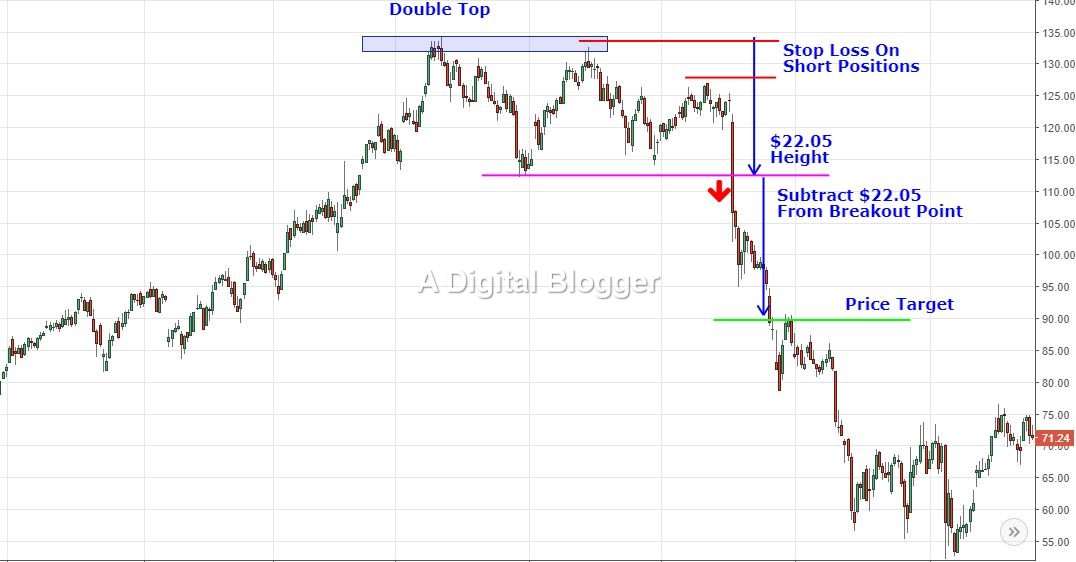
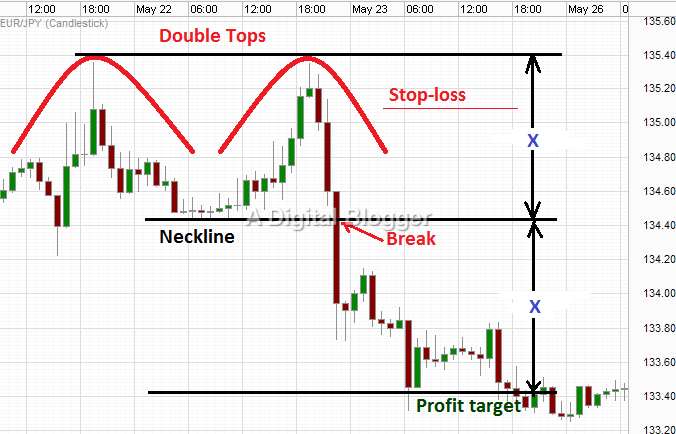
When a double top pattern appears, a stock market trader would enter just below the neckline, expecting that a trend reversal is about to take place. An interesting fact about double top patterns is that the drop that follows the double top travels the same distance downward as the height of the double top pattern candlestick formation.
Traders may feel that they can start trading using the double top pattern once they encounter the second top.
But the true confirmation for a double top pattern is actually its neckline. Traders attempting to take action on a daily basis must make sure that they see a close below neckline before they start trading.
It is possible to make consistent profits trading by using the double top pattern. To make the most of this candlestick setup, a trader must know how to test the neckline as a form of resistance.
This perspective of trading is the first step to achieve a good risk-to-reward ratio for long-term success. Retesting means that a trader waits to see whether the market breaks the neckline. Assuming that this level is a new form of resistance, the trader may look for a price drop with a bearish pattern, and then confirm it as a new resistance level.
The confirmation signal for the pattern is exactly in between the two tops of the pattern. A break in the line signifies a reversal confirmation signal and is the opportunity to expect a drastic change in the primary trend.
Once the trader has confirmed the pattern, it is time to check the size of the pattern formation. The price target for the stock is obtained by adding this range of formation of the pattern to the breakout level.
Double Top Pattern Screener
There are several strategies to ideally manage risk using the double top pattern.
Traders may sometimes feel that its stop loss is to be placed above the lower top. When you adopt such a strategy, your win-loss ratio becomes less than 1:1. Analysts agree that the success ratio of a double top pattern is 65%-70%, and this type of stop-loss strategy may put a trader in a losing position.
An ideal point to place the stop-loss would be close to the entry price.
A trader may is frequently advised to place a stop-loss at a candlestick high after the second bottom. When you spot a consistent price move after a bearish bottom, with no corrections, then the best spot for the stop-loss is exactly in between the second bottom and the trigger line.
This technique gives the trader a 1.8:1 win-loss ratio and is a profitable move.
Double Top Pattern Confirmation
Before diving into any pattern analysis, you need to be sure of whether the pattern even exists in the first place. Thus, a confirmation is a mandatory requirement for any pattern recognition.
You look for this:
- The stock does bearish after hitting a top value.
- It marks a bottom before it starts to move in the bullish direction again.
- It reaches a similar top, if not exactly the same and then goes bearish again.
- If the price reaches the same level, it reached in step 2, well you have a double top pattern, right in front of you.
These steps, if happen, will provide you with a confirmation of this pattern formation and you can initiate your analysis towards this direction.
Double Top Pattern Rules
Double top patterns are suitable for any type of market conditions.
The double top pattern is similar to the triple top pattern and differs in terms of the number of resistance retests involved. To avoid losing money, it is prudent for traders to look for a good double top reversal by considering known rules.
The first rule is to identify the market phase. It is important to determine which way the market is going, up, down, or sideways. The double top pattern is also characterized by a preceding uptrend.
In step 2, the goal is to identify the historical precedent, which may be two rounded tops, or price formations occurring after uptrends, that make a breakout appropriate for trading. While spotting the pattern in this step, traders may understand that the size of the tops is variable.
Thirdly, it is important to keep in mind that a variation of 10 pips, occurring between the two tops, is the maximum a trader can look for, although flexibility is recommended. In practical situations, the two tops may not happen at exactly the same price level.
As a fourth step, the ideal time to initiate selling is when a shift in momentum is detected. This is the much-awaited breakout and indicates a time to start making profits.
As a final step, set the minimum profit target as two or three times the distance from the double top to the neckline. Flexible profit targets almost always lead to successful trading. The final step is to locate a target area for a protective stop-loss which is the little above the resistance of the double top reversal pattern.
To sum it all up, the double top reversal pattern is a good indicator of prospective selling opportunities. As long as you understand its key aspects, it turns out to be profitable most of the time.
Double Top Pattern Target
Setting a target price while using a double top pattern is relatively easier. While you are analyzing the stock trend through any chart, just measure the size of the complete pattern. And you need to start measuring from the neckline itself.
Furthermore, when you have the whole range, you can consider it as your MINIMUM target. Of course, it can be a bit more than based on your analysis and patience.
When the price reaches around that spot, you may choose to exit the trade, ideally.
Double Top Pattern Stop Loss
As you look to place the target price, it makes sense to place a stop-loss as well. This certainly helps in limiting your losses in case the market goes south i.e. opposite to your expectations.
In a double top pattern, the stop-loss can be placed above the second top of the pattern.
Placing stop loss at this spot will help your trade to negotiate any transaction pressure and will automatically exit you in case the stock hits that price point.
But, you need to make sure that this stop-loss price does not get compromised based on any gut move or any market threat.
Types of Double Top Pattern
There are 4 types of double top patterns based on their respective average rise and failure rate percentages. Here are those:
- Adam – Adam
- Average Rise: 35%
- Failure Rate: 5%
- Adam – Eve
- Average Rise: 37%
- Failure Rate: 5%
- Eve – Eve
- Average Rise: 35%
- Failure Rate: 4%
- Eve – Adam
- Average Rise: 40%
- Failure Rate: 4%
Although, these are named a bit unconventionally, however, they do provide you with a strong notion of what these actually imply.
When a stock is staying bullish consistently and reaches its prime high before it starts dropping. This prime point is called Ultimate high. The average rise is the measure of the price movement from the breakout point to the above described prime point i.e. ultimate high.
Similarly, the breakout point is used to calculate the frequency of how often the stock price fails to rise above the breakout point. That frequency, when seen with the overall number of attempts, gives you the failure rate.
In case you are thinking of getting started with stock market investments or trading, let us assist you in taking the next steps forward:
More on Share Market Education
In case you are looking to learn more about Chart Patterns, here are some reference articles for you:
Summary
Reviewer
A Digital Blogger
Date
Broker Name
Double Top Pattern
Overall Rating
