


Looking for Low Brokerage, High Margin & Free Tips?
Swing Trading Strategies
More on Online Share Trading
Are you in into swing trading? Do you employ swing trading strategies in your trading decisions or go by your gut? What kind of technical analysis of stocks you use in your stock market investments?
Well, if you have not been using any strategy yet or still looking out for other swing trading strategies you may use, this detailed review will assist you in taking the right steps ahead.
But before that, let’s go through some of the basics!
The term swing trading implies capturing gains using swings or up and down movements in the prices of stocks.
There is a Difference between Swing Trading and Day Trading i.e., Swing Trading is a method of short term trading in stocks and options in which the trades can square off within a period of few days and sometimes, even a couple of weeks. Whereas, Day trading allows the trader to hold the securities for a longer period and can trade accordingly.
Swing Trading Strategies For Beginners
Basically, in this form of trading, a trader wants to benefit from a swing or a move in price movement in a particular direction by following the short term trend.
If you are looking to learn how to start swing trading, you need to know that all strategies in a swing trading setup must have three key elements which are:
- Entry Level – The point where a trade is entered into. This point is generally determined with the help of technical indicators.
- Exit Level – The predefined target where the trade should be squared off after taking a profit.
- Stop Loss – The predefined point where the trader should square off his/ her position by taking a loss if the market starts to move in an unfavourable direction. This is a must for every trader in order to protect oneself from huge losses.
There are many swing trading strategies, some of which are simple and some are complicated which require detailed knowledge of technical indicators.
In addition to analysing price trends and chart patterns using technical analysis, one can use the knowledge of fundamental analysis of stocks as well.
One thing that should be common to all the strategies is to follow the stop loss very strictly and exit the trade once the predetermined target point has come in order to earn profits on a regular basis and prevent oneself from huge losses.
Now, let us discuss some of the most powerful swing trading strategies:
1. Price Action Strategy
In this strategy, swing traders try to benefit from the opportunity that arises when the tendency of movement of the price of a stock in a certain direction breaks.
At that point in time, a new possible opportunity to trade arises.
Price action is observing the reaction of the price at certain levels of support and resistance. In order to understand this, let us first try to understand the meaning of support and resistance levels.
Support level occurs below the current market price and shows an area where buying pressure is strong enough to overpower selling pressures. This results in an upward movement of price when the price is trying to touch support levels. A swing trader should enter a trade at the bounce off the support level.
Exit point should be pre-decided after booking a profit. Stop-loss should be set a little below the support level. The picture below shows the making of resistance and support levels.
In a similar way, Resistance level occurs above the current market price and indicates a region in which selling pressures are higher enough to overpower the buying pressures. As a result of this, the price tends to move downwards after trying to touch the resistance levels.
In order to benefit from this price reversal, a swing trader should enter the trade by taking a short position at the bounce off the resistance levels. In this case, the stop loss should be pre-decided a little above the resistance levels shown on the charts.
In order to determine support and resistance levels, there are many strategies that are used by traders using different technical indicators.
2. MACD Trend Following Strategy
This is one of those swing trading strategies which follows the “go with the flow” attitude. A trend-following indicator tells us about the overall direction of the movement of the prices of stocks.
On the other hand, a momentum indicator tells us about the speed in which the trend has been moving. Moving Average Convergence Divergence or MACD is one of the best trend following and momentum indicators. It is quite simple to grasp.
In order to understand this strategy, one needs to understand the MACD line and the signal line. The interaction of these 2 lines indicates buy and sell signals.
A bullish trend is indicated by the crossing of the MACD line above the signal line. This is called a bullish crossover where a trading opportunity arises. At this instant, a long trade can be initiated.
In a similar fashion, a bearish trend is indicated by the crossing of the MACD line below the signal line. This is called a bearish crossover where another trading opportunity arises.
At this instant, a short trade can be initiated. After entering the trade, a swing trader needs to wait for the crossing over of these two lines again which signals the opposite trend. This is the exit point where the trader can book profits in the trade entered.
Example – This swing trading strategies have been explained in the below picture using Bhansali Engineering Polymers Limited (BEPL) stock that trades on the National Stock Exchange (NSE).
Trading opportunities can be seen in the stock at the bullish and bearish crossovers.
Also Read: Top Intraday Trading Strategies
3. Simple Moving Averages Indicators Strategy
This is one of the simplest swing trading strategies which require the knowledge of simple moving averages or SMAs. A 10 day and 20 days SMA can be calculated by taking out the average of the last 10 and 20 days closing prices of the stocks, respectively.
When the 10 day SMA crosses above the 20 days SMA, a trader should read it as a bullish sign and enter into a long trade.
Similarly, a bearish sign is read when the shorter duration 10 day SMA crosses below the longer period 20 day SMA. At that point in time, a trader should take a short position as the price movement is expected to be negative.
4. Fibonacci retracement strategy
This is one of the widely used swing trading strategies.
The term “Fibonacci retracement” is used in technical analysis which refers to the resistance or support levels. Fibonacci retracement levels determine possible support and resistance areas using horizontal lines.
These levels are associated with percentages like 23.6%, 38.2%, 61.8% and 78.6%. These are the classic Fibonacci ratios which are used for predicting potential reversal levels.
These are the levels where price could stall or reverse. In case of a downtrend, if price retraces to and bounces off the 61.8% area, a swing trader can enter into a short position. This 61.8% level is acting as the resistance level.
The short position can be squared off when the price reaches down to and bounces off the 23.6% Fibonacci line. This 23.6% level is acting as a support level.
The below chart shows the Fibonacci level on the stock price chart of Cipla.
Although the levels should not be relied on exclusively. For this reason, a stop loss should always be decided before entering any trade.
Also Read: Top Algo Trading Strategies
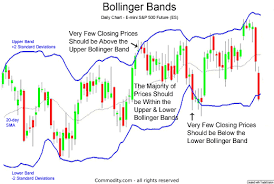
5. Bollinger Bands Indicator Strategy
This is one of the most popular swing trading strategies. To understand this strategy, one should be well versed with the knowledge of technical indicator called “Bollinger Bands“.
This technical indicator is used in determining overbought and oversold areas of stocks. Let us first try to understand what a Bollinger band is. It is made up of three bands. The middle band is a simple moving average of certain time duration and the upper and lower bands are at a distance of 2 standard deviations from the middle line.
It looks like the one shown in the picture below:
This indicator is used in swing trading in the following way:
- The first thing is to wait for the price to touch the upper band which means that the stock price has entered the overbought territory.
- In order to confirm that the trend is going to reverse, a swing trader needs to wait for the movement of the price below the middle Bollinger band. This clearly marks a change in the sentiment.
- In order to determine the entry point of trade, candlesticks can be studied. A big red candle breaking the middle Bollinger band should be visible which closes near the lower end of the candlestick. This candle is important because it also determines the stop loss point. The higher end of this candle would be stop loss. If this is hit, it would mean that the reversal was fake.
- A profit should be booked if the price breaks and close back above the middle Bollinger band.
If you are a beginner then you can learn all these strategies and complex concepts by referring some of the best swing trading books.
Conclusion
Swing trading is one of the many ways of making money through the stock market in a short amount of time.
Although just like any other kind of trading, swing trading strategies require a lot of discipline and practice in order to earn consistent profits.
Knowledge of technical indicators is a must for learning to implement swing trading strategies.
There are many strategies and some of them are very complex and can be overwhelming. A trader should carefully choose that strategy which suits him/her the most and is simple to understand and grasp.
Are you looking to get started with using trading strategies, let us assist you in taking the next steps ahead? Just fill in a few basic details below to get started:
Summary
Reviewer
A Digital Blogger
Date
Broker Name
Swing Trading Strategies
Overall Rating

One Comment
Thanks for this awesome info