


Looking for Low Brokerage, High Margin & Free Tips?
Technical Analysis for Options Trading
| | Option Trading | No Comments
Check Stock Market Education Topics
Options trading the popular yet not completely understood by most of the traders. Irrespective of its complexities, it holds one thing in common with other trading segments and that is understanding and analysing charts and its patterns. Technical analysis for options helps you in planning your trades and strategies.
So, let’s understand how a trader must start and do technical analysis for options trading.
How to do Technical Analysis for Options Trading?
Technical analysis in itself is a vast topic that includes understanding charts, patterns, indicators etc. This makes it even more confusing for a trader to strategize their trade.
However breaking it down and using some simple tools and techniques can help a trader in excel options trade.
But what are those tools and how to make sure that you are using the right tool for analysis.
Well! The right one completely depends upon an individual’s choice but one must have a clear objective of what they are expecting.
For example, if you want to determine the right trend of the market, then there are trendlines but at the same time there are indicators like moving average and super trend that gives you an understanding of the overall direction of the market.
Here we have provided some of the useful and result-driven steps for doing technical analysis.
-
Choose the right stock or index
Before you start options trading it is important to determine whether you want to trade in index or in stocks.
Now, the question is what’s the difference.
Well, there is!
On one hand where indexes are highly volatile, stock volatility is quite low and so is the liquidity. These two parameters change the way you analyse them and to plan entry and exit in trading.
Targeting the general retail traders, they generally prefer doing trade in Nifty and Bank Nifty. Both these indices have weekly and monthly expiries and are traded in high volume.
-
Determine the Market Trend
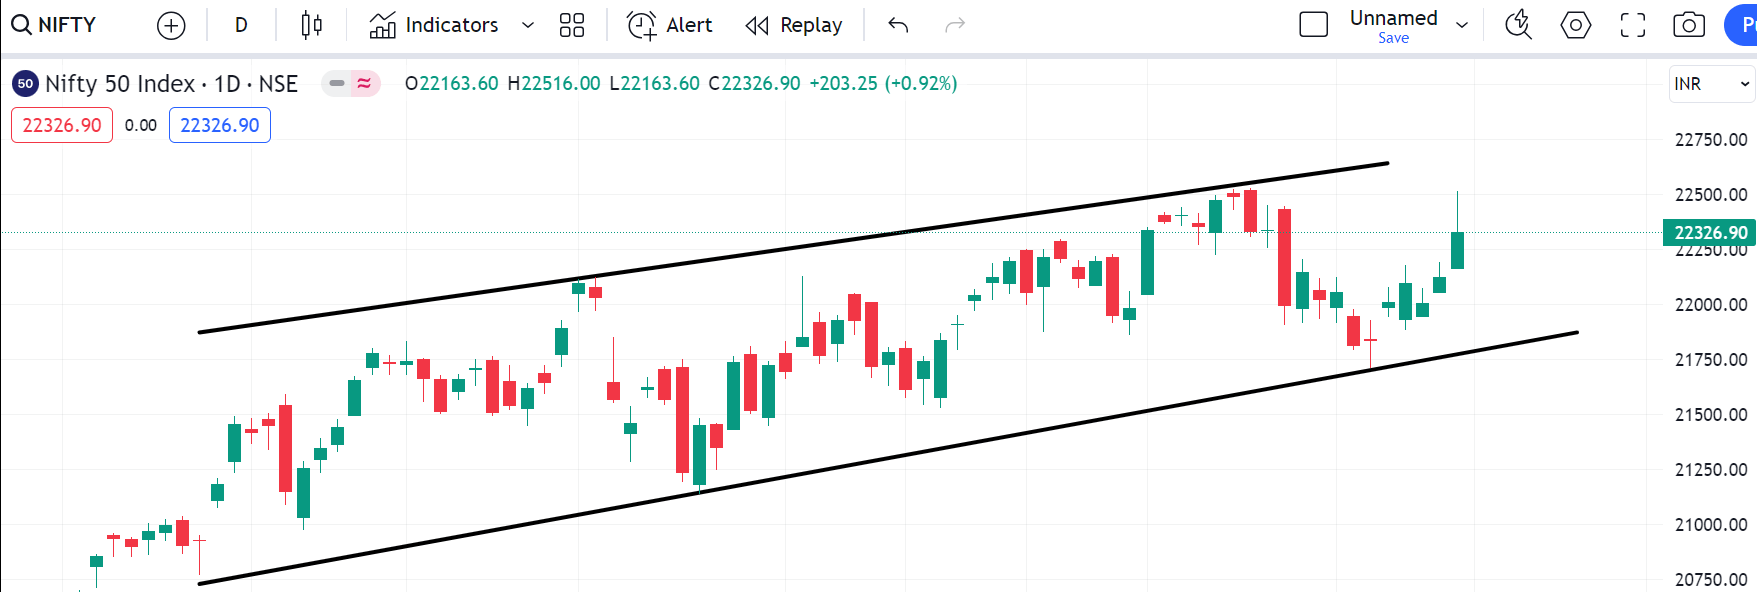
Once you make a decision of index or stock, the next step is to determine the market trend. For these the simplistic approach is to draw a trendline in the daily time frame.
Let’s understand this with an example:
Looking at the above image, there are two trendlines, one joining the low price and other the high price.
The lower trendline directs towards upward direction and thus confirms the uptrend in the market. This can also be confirmed using the 20 period moving average.
-
Determine Market Volatility
In the image above, the market is in uptrend but has higher swings which implies the high volatility in the market.
High volatility increases the option trading risk but at the same time brings in an opportunity to make profit by taking position on the call side.
On the other hand, low volatility in the market increases the chances of loss for option buyers because of theta decay.
-
Identify Breakout or Breakdown in the Market
Another way to take position in the options using technical analysis is by determining the breakouts or breakdown.
For this first draw support & resistance level at the daily time frame. If the long green daily candle breaks resistance it gives an indication of upcoming uptrend in the market. On the other hand the red candle breaking support indicates downtrend.
However this is not enough. One must confirm the breakdown or breakout in the smaller time frame before taking the position.
For example on determining the breakout on the daily time frame, it must be confirmed in the 1 hour chart to take a position.
-
Use Technical Indicators for Options Trading
There are different tools of options trading and the most favourite among beginner traders is technical indicator.
But there are hundreds of indicators which increase the confusion and difficulty of option traders to do smooth analysis.
However, in the family of indicators there are a few indicators that provide useful information with higher accuracy.
Here is the list of some of the indicators that can be used for technical analysis of options trading.
- Moving Average
- Bollinger Bands
- Relative Strength Index
- Moving Average Convergence Divergence
- ADX
- PCR
- Supertrend
Indicators are generally lagging and therefore one must consider using them in combination (not more than 3) to get the best result.
For example combining a moving average with RSI helps in determining momentum and trend analysis on charts.
In the same way MACD indicator used with Bollinger bands, gives an idea of trend, momentum and volatility.
If you are a beginner in options trading but not able to make profit even after following the right tools and practice of technical analysis then there is something you are still missing.
What?
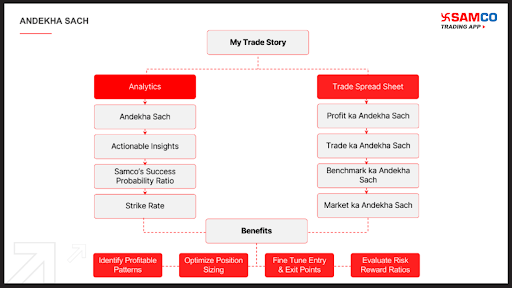
Your own trading record that tells the Andekha Sach of your trades.
The feature ‘My Trade Story’ in the Samco App provides an overview of the total profitable and loss making trades and provides a probability success ratio that makes it simpler for a trader to determine his level of trade.
Not only this, on the basis of the score it provides the ways that help in improving your trade results.
-
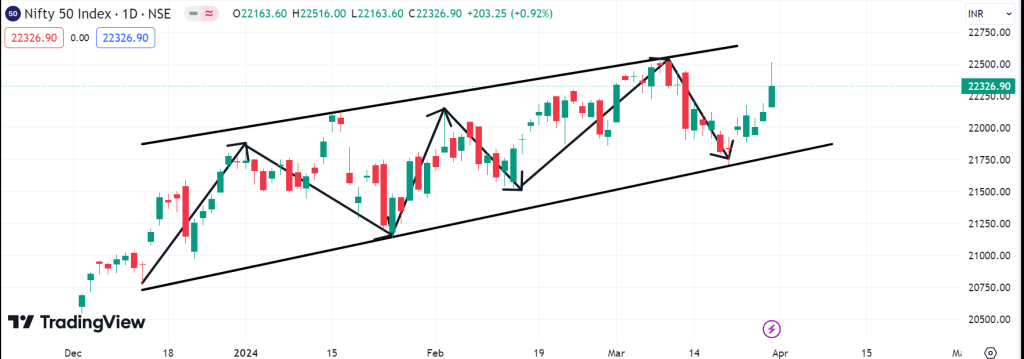
Determine Patterns to Identify Reversal and Trend Continuation
Now you must be aware of the price action where the trader read the price movement rather than depending upon the indicators and other tools.
Some of the common candlestick patterns that help in determining bullish reversal are hammer, morning star, bullish engulfing, bullish harami, etc.
On the other hand, patterns like shooting star, evening star, bearish engulfing and bearish harami give an indication of bearish reversal.
But the question is how to predict bank nifty movement and other indices trend and reversals using these patterns?
Here is the way, in the image below the hammer pattern is formed near the support level. The breakout of the high of hammer in the 15 min chart by the long green candle gives a confirmation of the upcoming uptrend.
This brings an opportunity for the option buyer to take position on the call side and option seller on the put side.
However to reduce the risk and to increase the chance of making profit in the market one must confirm the trade position using momentum indicators like RSI or some other technical tools.
Not necessary but there are traders who trade options by doing derivatives analysis using option chain. Now the option chain gives details of the strike price and expiry and other than this provides an overview of the long and short buildup positions using OI data.
OI or open interest provides information on the number of contracts open or not squared off yet. This gives an idea of the option sellers in the market and further support & resistance level.
For example, if Nifty is trading at 21,500 and the OI at 21800 CE is increasing and the highest then it indicates the new positions opening at that strike price.
This number also gives an idea of the sellers opening new positions at 21800 CE which means there is a higher possibility that the market will not go beyond Nifty 21800.
Hence one can identify the resistance level using OI data. Similarly the put side OI data provides support level.
How to Learn Technical Analysis for Options Trading?
If you are a beginner, then it is important to focus on understanding how options works and learning technical analysis to get better results. Wondering how to learn and from where to begin.
Well, for that there are steps too.
To clear the concept of options trading, one must focus on option trading books as it helps in clearing the concepts.
You can also enrol in the online or offline classes to get a better understanding of options and technical analysis concepts or watch some reliable Youtube videos for FREE!
Choice varies but the end result and objective remains the same, i.e. to increase knowledge and to maximise profit in trading.
Conclusion
Options trading is a vast and complex topic and so is technical analysis. The right knowledge is not enough; execution is equally important to master technical analysis in options trading.
Following the right step and strategies by learning and practice can make anyone the profitable trader.
So, keep exploring and learn to minimise losses in the market.
Just fill in some basic details in the form below and a callback will be arranged for you:
More on Share Market Education:
If you wish to learn more about options trading or the stock market in general, here are a few references for you: