


Looking for Low Brokerage, High Margin & Free Tips?
Best MACD Setting for Intraday
More On Technical Indicators
MACD or Moving Average Convergence Divergence is the trend-following indicator that depicts the momentum of the specific trend. No doubt, the indicator tells a lot about the current trend but are you aware of the best MACD setting for intraday?
If not, then here is the complete information on how you can read the indicator and use this intraday trading strategy for maximizing your profit.
Let’s get started.
How to Set MACD Indicator for Intraday?
Let’s begin with the setting of the MACD indicator. For this, here we have used Tradingview.
You can also set the MACD inputs using charts on any of the technical analysis apps.
After you open the candlestick charts of the stock in which you want to trade, next set the time frame. To increase the sensitivity of the information, it is good to choose the 5 minute or 1-minute chart frame.
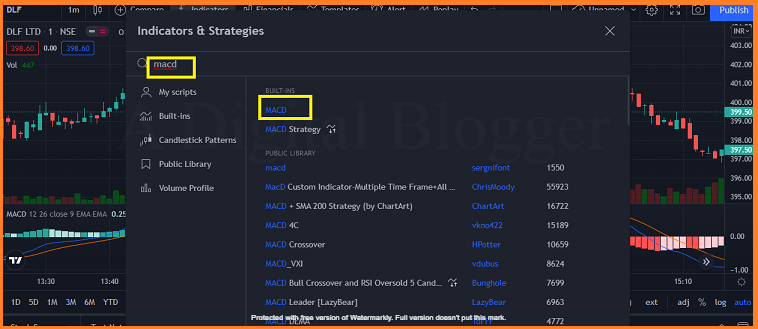
Once done click on:
- Indicators
Select the MACD Indicator.
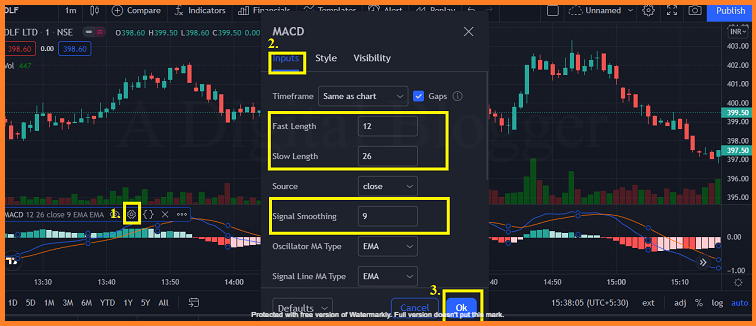
- Tap on the Settings button of the indicator.
- Click on ‘Inputs’ and enter the length of indicators. Here it is set as default (12,26,9).
*This length is further explained in the article.
3. Click on ‘OK’
The indicator with the provided settings is displayed on the screen.
But how to read this indicator and what does it indicate?
For this, let’s move into the detail.
How to Use MACD in Intraday Trading?
Above we have discussed the basic aspect of the indicator, but when it comes to getting accurate results, one should understand the best MACD setting for intraday trading.
For this let’s have a brief understanding of the indicator.
The MACD indicator is the lagging indicator and is used to analyze the upcoming trend.
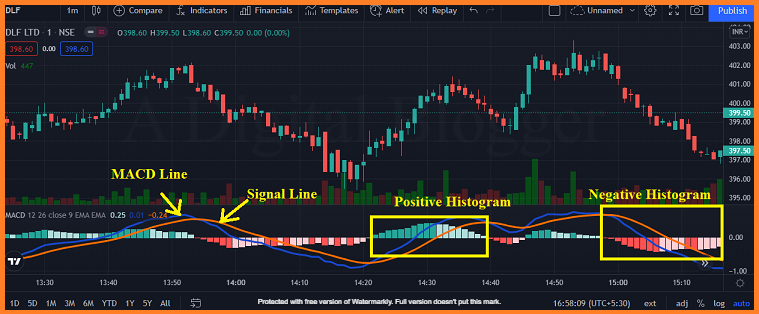
Now the two different lines (blue and orange) shown are the MACD line and signal line respectively. The signal line is constructed using the 9-period EMA while the MACD line is constructed by subtracting 26-Days EMA from 12-days EMA.
For intraday trading, you can use different MACD settings like 5, 35, 5, or 3,10, 16.
Here in the former, the signal line is constructed using 5-period EMA while the difference between 5 period EMA and 35-period is used to construct the EMA line.
In the latter case, 16 defines the period of the signal line while the difference between the first two numbers (3,10) constructs the MACD line.
Apart from this, there is a zero line or the center line that separates the positive area from the negative area.
And since, it is a momentum indicator, it oscillates between these two areas to give an idea about the current market condition to the traders.
Also, there is the histogram. Now, what is the role of histogram in MACD indicator, and how does it help the trader in doing technical analysis of a stock for intraday trading?
Since MACD is the lagging indicator, sometimes the crossover occurs late thus affecting the risk-reward ratio of the trader. To cope up with such flaws, one can rely on the histogram.
How?
When the MACD line crosses the signal line from above, it gives the bearish signal and thus gives a strong signal of a downtrend.
When this crossover occurs below the zero line of the indicator, it creates a negative histogram. It will continue until the MACD line is below the signal line.
Further, more the divergence between MACD and signal line wider the histogram and vice versa.
Conversely, when the MACD line crosses the signal line from below, it is the strong bullish signal where traders can take a long position.
Now as described above, in such cases, the histogram is positive and further becomes wide or narrow depending upon the divergence between MACD and signal line.
These crossovers and the corresponding trends are shown in the image below.
Not only the uptrend or downtrend, but this indicator also gives you the information when the stock price can enter the consolidation phase.
As shown in the image above, there is the phase when both the lines converge above the zero line with multiple crossovers.
Corresponding to this, the price is under the consolidation phase.
So, this is the time during the day when traders should not take any decision and wait for the crossover that gives the trend details more accurately.
This is how you can make the use of MACD indicator to understand the market trend and to make the trading decision at the right time.
No doubt MACD indicator helps in analyzing the trend, but for an intraday trader, it is always good to use some of the best intraday trading indicators like RSI or ADX to get better results.
To get started with know the RSI strategy for intraday and further use the best combination of technical indicators for intraday trading
MACD Divergence Trading Strategy for Intraday
Apart from the current trend information, the MACD indicator gives us the information of the trend reversal as well.
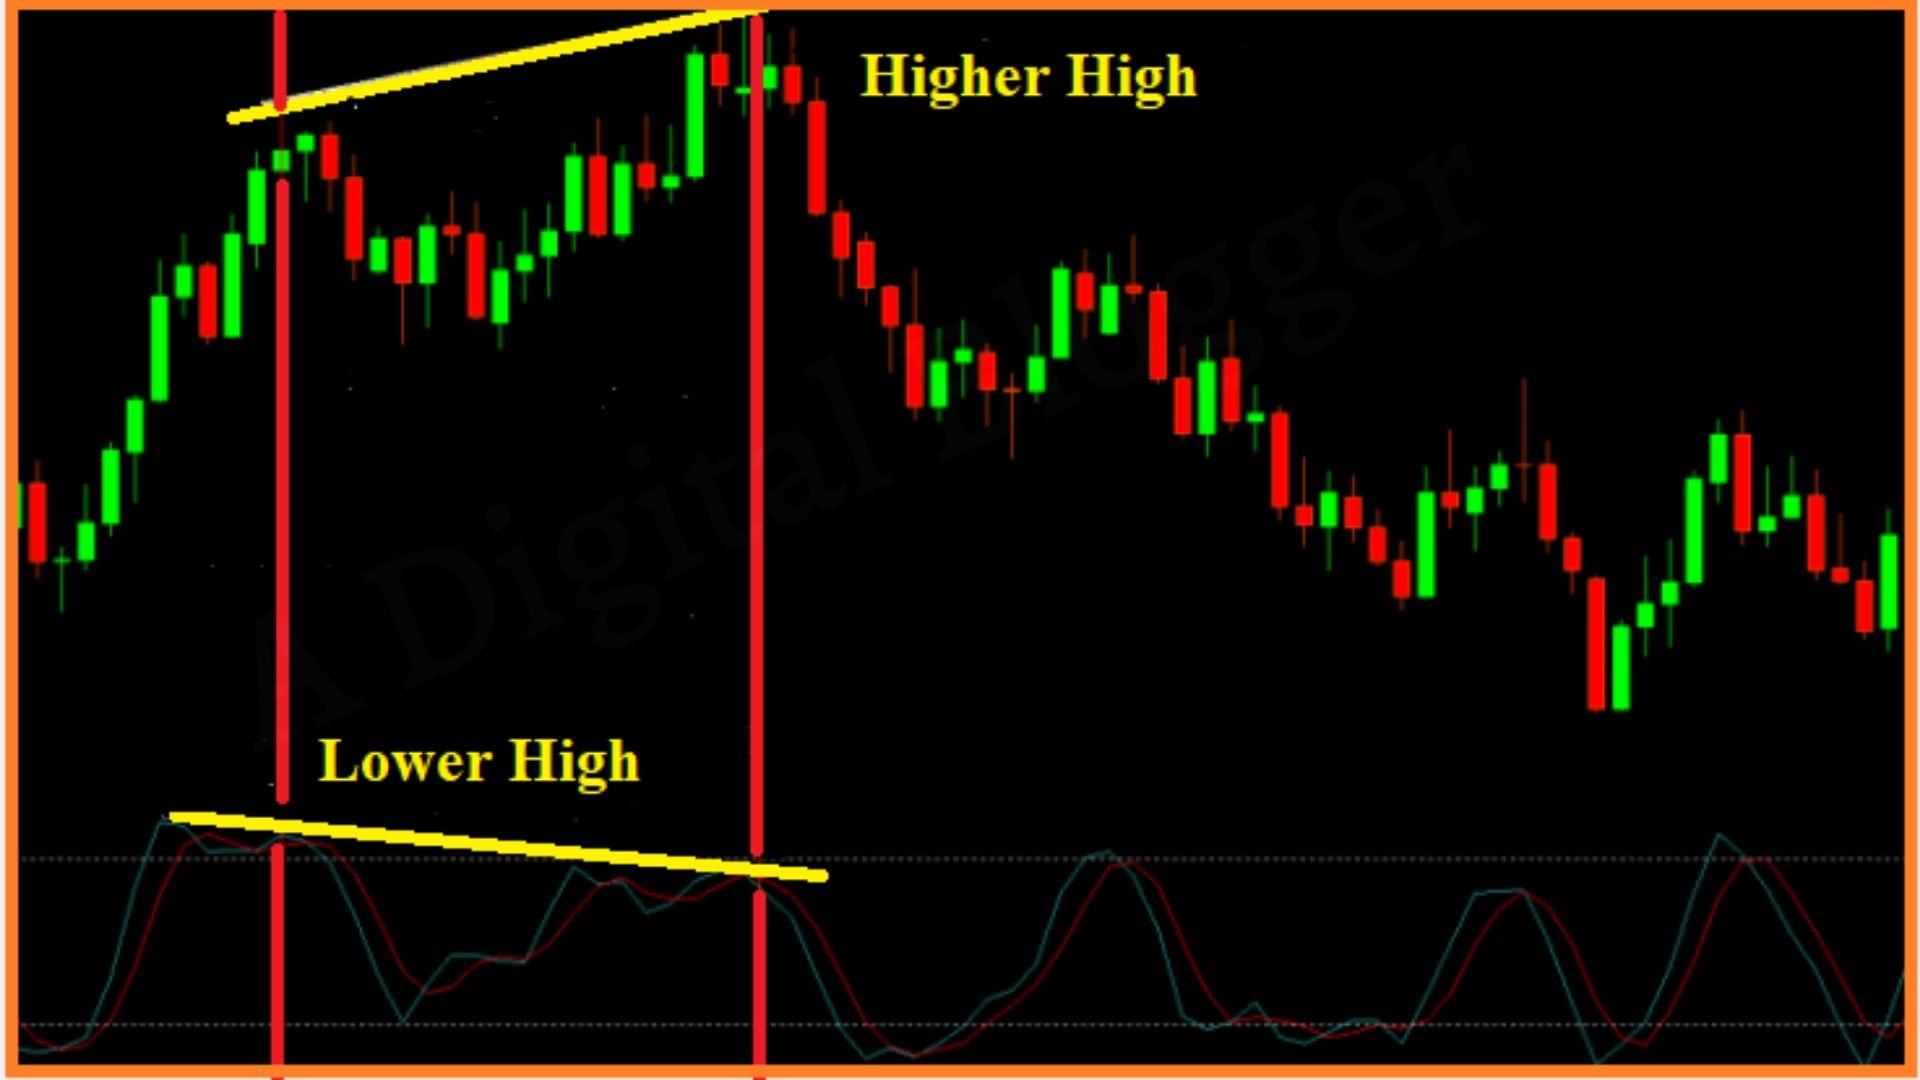
To understand this, refer the image below:
It is now clear that the MACD either trends in the positive direction or in the negative direction depicting the bullish or bearish trend respectively.
But when the trend going to reverse from bullish to bearish, this could be well-understood by understanding the MACD divergence.
As shown whenever the MACD indicator makes a lower high while the corresponding price makes a higher high this is the strong signal that the bullish trend is going to reverse soon.
Similarly, when MACD makes a higher high while the price marks a lower high it marks the end of the bearish trend.
This is how MACD divergence help in analyzing the trend reversal.
Is MACD Good for Intraday Trading?
Since MACD is the trend momentum indicator it gives an idea of the upcoming trend to the traders. Also, it uses multiple components (EMA, MACD, Histogram) that further make it easier for the trader to do analysis and to take the right position in intraday trading.
To get better results use the best combination of indicators and understand the divergence to make a trade decision according to the trend.
Get into the trade now with the renowned stockbroker, by opening a Demat account online for FREE!
More on Intraday Trading