


Looking for Low Brokerage, High Margin & Free Tips?
Bullish Marubozu
| | Chart Patterns | No Comments
More Chart Patterns
Bullish Marubozu? What a strange name for a trading strategy, right? Well, let’s find out what it means and how it actually works in real-time stock market trading in this detailed review.
But first, let’s start with the basics.
One of the best ways to earn a living out of stock markets is to select stocks on the basis of technical analysis. There are many candlestick patterns on the basis of which direction of stock prices can be predicted. Some patterns are made from multiple candlesticks and some are made of single candlesticks.
One of the most important single candlesticks patterns is Marubozu.
A trade signal is obtained on the basis of trading action of one day only. One can trade in stocks, indices, currencies or commodities using this pattern.
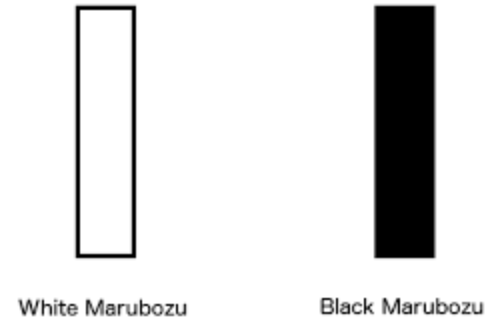
Marubozu is of two types – Bullish Marubozu or White Marubozu and Bearish Marubozu or Black Marubozu. White marubozu can also be referred to blue marubozu and black marubozu is also called red marubozu.
In this article, let us try to learn about Bullish Marubozu pattern and various aspects related to it.
Bullish Marubozu Candlestick Pattern
Marubozu is a Japanese word which means “bald head” or “shaved head”. In the context of candlesticks, it means that the upper and lower shadows are absent. Only the body of the candle can be seen.
This implies that the open price is the low price of the day and the close price is the high price of the day.
This basically indicates that the market forces are so bullish in nature at that particular time that buying has been done at every price during the whole trading session.
Bullish Marubozu Candlestick Technical Analysis
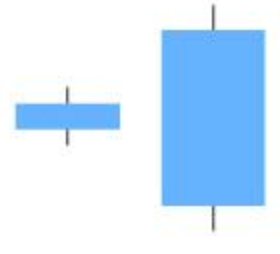
A Bullish marubozu candle suggests that there has been a change in market sentiments. While doing technical analysis, a trader needs to look at the length of the candlestick formed as the length says a lot about the range of the price movement during the day.
Short candles mean that the activity of buying has been subdued. On the other hand, long candles mean that the activity of buying during the day has been quite intense which signals extreme bullishness for the stock.
The picture below shows short and long bullish or white marubozu.
Bullish marubozu candlestick chart can signal two things –
- Bullish Marubozu in Uptrend (Continuation of the Existing Uptrend) – If a Bullish marubozu candle is spotted at the end of an uptrend, the trend is more likely to continue because It implies extreme bullishness in an already existing uptrend.
- Bullish Marubozu in Downtrend (Beginning of the Bearish Trend) – If a Bullish marubozu candle is spotted at the end of a downtrend, the trend is more likely to reverse and an uptrend is likely to follow because it implies that the stock prices have reached a support level after witnessing a long downtrend.
This candle is generally accompanied by high traded volume. To initiate a trade, one needs to confirm whether it is a continuation of the uptrend or the beginning of the reversal of the trend.
When a Bullish marubozu has been identified on charts, one should also remember to use other technical indicators as well.
For example, looking at the Relative Strength Index (RSI) can tell whether a stock price is there in an overbought or oversold zone. This can provide additional help in deciding whether to initiate a trade or not.
Bullish Marubozu Strategy
Now, let us discuss how a Bullish marubozu can be used as a strategy to place trades in the markets and earn through it.
There can be two types of trades one can place according to the amount of risk one wants to take.
- The first kind of trade can be taken on the same day when the Bullish marubozu is being formed. One needs to make sure that bullish marubozu is being formed on that day by checking two conditions –
- The open price of the day is approximately the low price of the day.
- At around 3:20 pm, the current market price of the stock or index is equal to the high price of the day.
- The second strategy that can be used for trading when a Bullish marubozu is formed is to trade on the next day. Let us say that today, a Bullish marubozu has been detected.
Then, in this case, a long position can be initiated tomorrow but only near the end of the trading session to make sure that a bullish candle is being formed on that day. It is a double confirmation that the bullish trend has been set in the market.
Note: An important thing to remember while applying this strategy is to check the length of the candlestick formed. A very short marubozu candle would indicate subdued activity which can go wrong.
On the other hand, one should avoid trading after an extremely long Bullish marubozu candle (around 10% range) has been formed because a long candle would mean a deep stop loss.
If the stock price starts to move in an unexpected direction, it could mean huge losses for traders.
Bullish Marubozu Stop Loss
There can never be a 100% surety on anything in stock markets. Therefore, one should always work with stop losses in order to shield oneself from making big financial losses.
So, if the stock prices start to move in an unfavourable direction, i.e. stock price starts to move downward, there should be a limit till which we should wait for it to move upwards again. And that limit is our stop loss which should be set at the low price of the Bullish marubozu candle.
Sometimes, it is possible that the stop loss is triggered but the stock price changes its direction again and starts to go up. This is a possibility with every trade and does happen many a time.
Despite these circumstances, one should always maintain discipline when it comes to taking a loss after hitting stop loss.
Bullish Marubozu Success Rate
If a Bullish marubozu is formed in an uptrend and with a gap up opening, it strongly suggests that the uptrend is going to continue. The success rate of the trade taken increases with volumes too.
If a bullish marubozu is formed along with increased traded volumes, it would most probably be a profitable trade.
That is because volumes always indicate the strength of market forces.
Bullish Marubozu Candlestick Screener
In today’s era of internet, there are many stock screeners available online in order to automatically select stocks on the basis of some predefined criteria.
Some of these screeners are free for usage, some require payments to be done and some come with trading accounts opened with a few brokers. They are extremely easy to use and make the process of selection of stocks much more convenient.
Bullish Marubozu Example
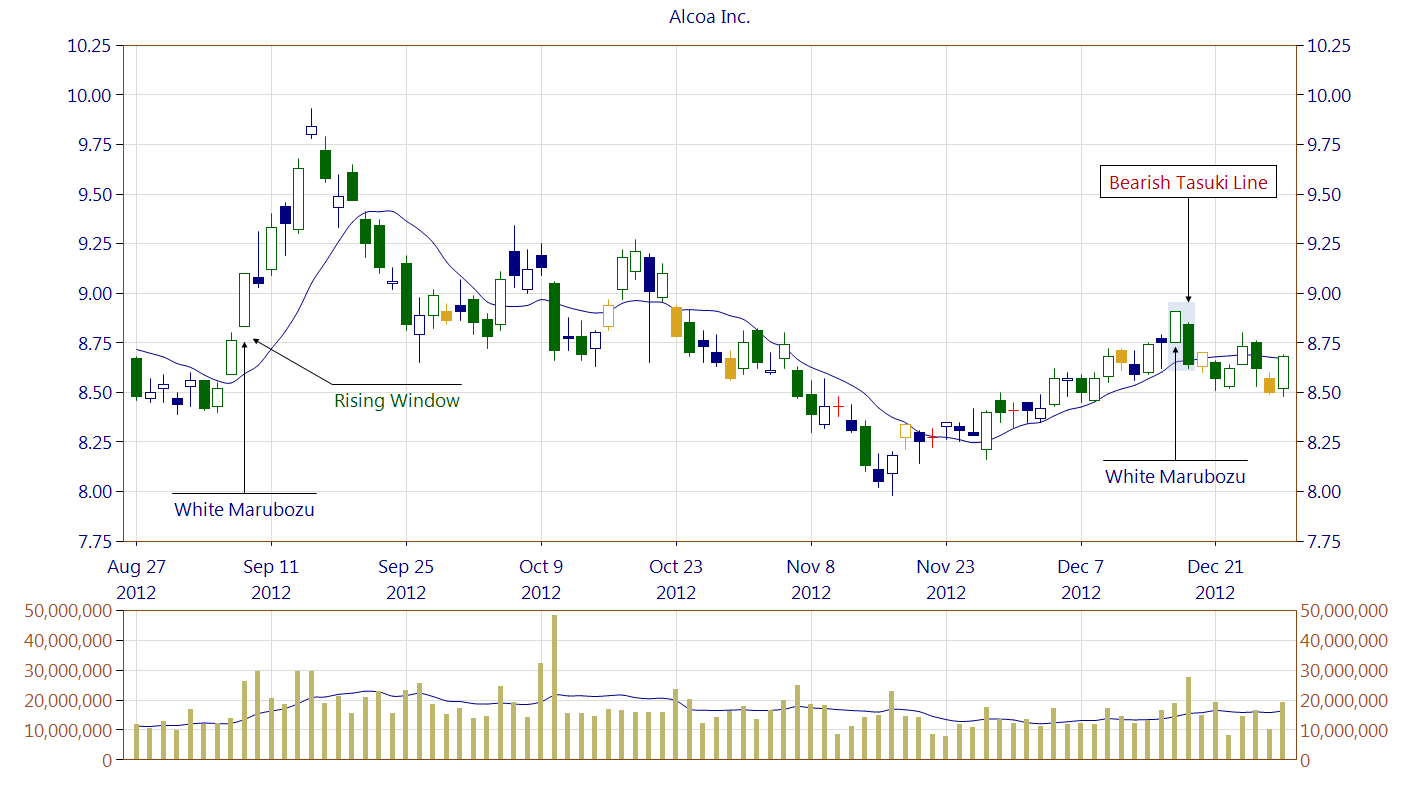
Please look at the picture posted below of daily charts of NIFTY50. A clear Bullish marubozu candle can be seen in the chart.
A green long marubozu candle has been formed at the top of the uptrend and the trend can be seen to be continuing for the next few days.
Conclusion
Marubozu candle means only the body of the candlestick with no upper and lower shadows. It is of two types – bullish or white and bearish or black.
Bullish marubozu is a single candlestick pattern which is used in technical analysis to predict bullishness in the stock market. If it occurs in an uptrend with large volumes, it might indicate the continuity of the trend. If it occurs in a downtrend, it might indicate the reversal of the trend.
One can combine it with other technical indicators like RSI in order to make decisions about trades based on Bullish marubozu candles. One should avoid trading in extremely short and long candles.
One can trade using marubozu candles in 2 ways as per one’s risk appetite.
The traders who wish to take more risks can initiate a long position on the same day that Bullish marubozu is being formed. And the traders who do not want to take greater risks can take a long position the next day after the white marubozu has been formed in order to be doubly sure of the bullishness.
One should always initiate positions with predefined stop losses. The stop loss should be the low of the Bullish marubozu candle.
Traders use stock screeners in order to get automatic alerts as and when this pattern is identified in a chart. One should make use of such online screeners in order to earn profits through the use of this pattern.
In case you are looking to use these strategies and patterns in your trades, let us assist you in taking the next steps ahead. Just fill in a few basic details to get started:
Summary
Reviewer
A Digital Blogger
Date
Broker Name
Bullish Marubozu
Overall Rating
