


Looking for Low Brokerage, High Margin & Free Tips?
Dark Cloud Cover Pattern
| | Chart Patterns | No Comments
More Chart Patterns
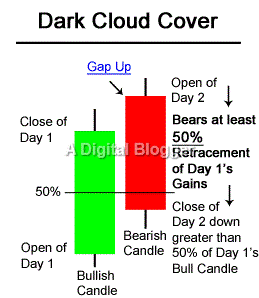
Dark cloud cover pattern is composed of two candlesticks. The first candle is a bullish candlestick, and the second one is a bearish candlestick. In other words, the first candle is a trending candle which is a lighter candle. The second candle is a reversal candlestick and is dark in colour.
The second candle is a precursor to the reversal of the market dynamics toward a bearish trend. This candlestick pattern derives its name from the analogy of a cloud hovering over a hillock. The pattern gives an impression of pessimistic market sentiment and must be analyzed well.
Dark Cloud Cover Pattern Formation
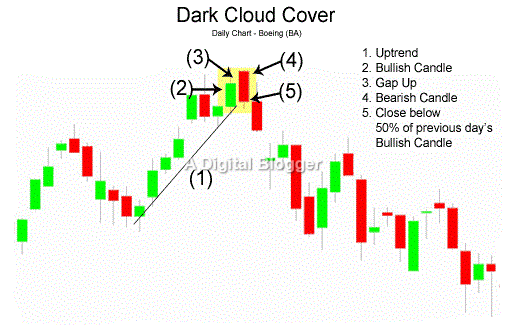
The dark cloud cover pattern is a large black candle after a bullish trend. The large black candle forms a dark cloud over the preceding candle. The dark cloud cover pattern is similar to the bearish engulfing pattern to the extent that a bullish candle is found at its opening point.
However, the bearish force takes control of the market later on and pushes the prices only lower. This shift in market control dynamics from the bulls to the bears is perceived as a sign of an impending bearish reversal.
A dark cloud cover pattern starts with a bullish candle in a bullish uptrend. This is followed by a gap up on the next day which turns into a bearish candle. The close of the bearish candle is below the midpoint of the preceding bullish candle.
Dark and light candlesticks in the dark cloud cover pattern have long real bodies. Their shadows are either very short or non-existent. A confirmation for the dark cloud cover pattern comes in the form of a bearish candle at the end of the pattern.
Dark Cloud Cover Pattern – Market Dynamics
At the opening of the market trend, an upward progression is observed with the price opening at its low and buyers willing to pay for the stock in an aggressive manner. The end of the session marks the close of the price and a bullish white candle is formed.
The price for the next day opens at about the previous day’s high end and this price variation is associated with the bullish candlestick.
The next day or time period features new buyers placing confidence in purchasing stocks and financial instruments. Old buyers are also keen on investing further. The supply is observed to increase during this period as a decrease in momentum is observed, leading to a fall in prices.
Diminishing prices encourages the bulls to invest more, and the bears start selling at higher price levels. In this scenario, the supply level is far greater than the level of demand, and the prices are automatically pulled down.
New buyers face losses, and in order to regain position, they start selling their securities. The position of bears continues to increase, prices fall even more, and when the session ends, the prices close below their initial opening position.
The resulting scenario is a black candlestick belonging to a bearish trend. The validity of the dark cloud cover signal depends on how well the close of the succeeding candle matches with the body of the previous white candle.
Dark Cloud Cover Pattern – Shall You Use it?
The dark cloud cover pattern is indicative of a weakness in the uptrend.
Stock traders find the dark cloud cover pattern significant as it serves as a market reversal signal which moves into a downward trend. Although the dark cloud cover pattern is not as strong as the bearish engulfing candlestick pattern, it does indicate a potential bearish trend.
Daily charts are most relevant for dark cloud cover patterns. However, they may be less significant in lower time frames. The dark cloud cover pattern serves as an important form of evidence for both options trading as well as swing trading.
Stock trading involves the exploration of certain features to evaluate the significance of a dark cloud cover pattern. The pattern is considered significant when the bodies of the previous up candle and the dark down candle are both long. A higher opening gap up by way of the dark cloud cover candle translates to a significant downward reversal trend.
Another factor which makes the pattern significant is when it occurs close to a major resistance level. In this context, when the gap is above the resistance level and the close of the candle is below the resistance level, the pattern is considered meaningful.
A higher level of confidence is also placed in the dark cloud cover pattern formation when a high volume of trading occurs at the time when the candles are formed.
The reliability of the dark cloud cover pattern depends on the place of its appearance on a price chart. A dark cloud cover pattern studied with respect to the pivot point, support and resistance lines, and trend lines help to accurately assess its reliability.
When a dark cloud cover pattern appears at a trend line or near it, or at a resistance line, the scenario is used as a confirmation that the trend line test is likely to fail. In a dark cloud cover pattern, the high point also serves as a resistance line and can be considered as a location for a potential stop-loss.
Dark Cloud Cover Pattern – Key Insights
Control shift towards sellers is an important aspect of the dark cloud cover candlestick pattern.
According to analysts, the penetration of the close of the second day must be at least 50% into the body of the lighter candlestick. This percentage is a measure of the bearishness of the market space. When the opening for the second day is above the resistance area and a close is below it, then the pattern is considered more significant.
Traders holding a long position perceive the dark cloud cover pattern as a signal for taking action on the second day by recovering the long position below the low point of the succeeding dark candle.
Short trade positions below the low point of the succeeding dark candle may take advantage of the pattern by placing a buy under the stop order above the height of a pattern. This may result in losses, especially when the uptrend continues to rise.
Stock traders must also note that dark cloud cover candlestick patterns may be observed in an uptrend even when no reversal happens. In this case, it may be indicative of a minor profit booking.
Stock traders must be careful not to confuse a dark cloud cover pattern with the bearish engulfing pattern. Although the two candlestick charts patterns are similar in appearance, they translate into two completely different market scenarios.
When a second candle closes below the preceding day’s open point, a bearish engulfing pattern is expected as opposed to a dark cloud cover pattern. That said, looking for a few known characteristics such as the length of the candle and volume help attach greater significance to the nature of the pattern.
A good understanding of the overall placement and perception of the candlesticks helps trigger a prudent reaction in response to market sentiments and leads to positive decision making.
In case you are thinking of getting started with stock market investments or trading, let us assist you in taking the next steps forward:
More on Share Market Education
In case you are looking to learn more about Chart Patterns, here are some reference articles for you:
Summary
Reviewer
A Digital Blogger
Date
Broker Name
Dark Cloud Cover Pattern
Overall Rating
