


Looking for Low Brokerage, High Margin & Free Tips?
Gravestone Doji
| | Chart Patterns | No Comments
More Chart Patterns
Gravestone Doji is a popular candlestick reversal pattern marking a time when the open, close, and low data points coincide with the low point for that trading day. Doji is part of the Japanese candlestick patterns terminology which is the form of the candlestick that occurs when the closing price comes back to the same level.
The body of the candlestick is little or it has almost nobody at all. Isn’t that easy to figure out? Let’s see how!
The doji shadow indicates price movement, following which the price reverted to the same level at the close data point.
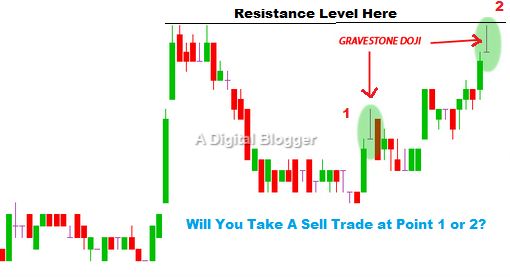
Gravestone Doji indicates bearish dominance and its chance of success increases when the candle formation occurs at the market top. The candle forms when the security prices to go up at a level that cannot be sustained. As this happens, the bears are successful in selling the security at its low point towards the end of the session. In Gravestone Doji, Gravestones actually represent the bulls that have lost dominance in their tug-of-war with the bears.
So bears beating the bulls, that is one battle won, right?
The close of the price and a breakout happens in the downward direction most of the time. Predominantly a bullish sign, Gravestone doji does not often occur in the bear market, to the extent that it may appear only once in the bearish space for every fifteen times, it appears in the bullish space.
Gravestone Doji Trading
Gravestone doji appears at a later stage in the uptrend and indicates loss of control by the bulls and a possible price drop. As the bulls lose control, the bears have more control over the market. This results in high volume sales. Furthermore, it needs to be known that this charting pattern may appear in a bullish as well as bearish setup.
The most important aspect to consider while trading with Gravestone doji is the size of the wick. In a bullish uptrend, the management of risk depends on the size of the wick. Whenever a gravestone doji is spotted in this kind of bullish uptrend, a trader may expect a trend reversal to happen in due course of time.
When gravestone doji is seen in a bullish trend, the entry point for a trade is generally the low data point of the candlestick. When a low occurs below this level, a short trading position is assumed.
Isn’t that intriguing?
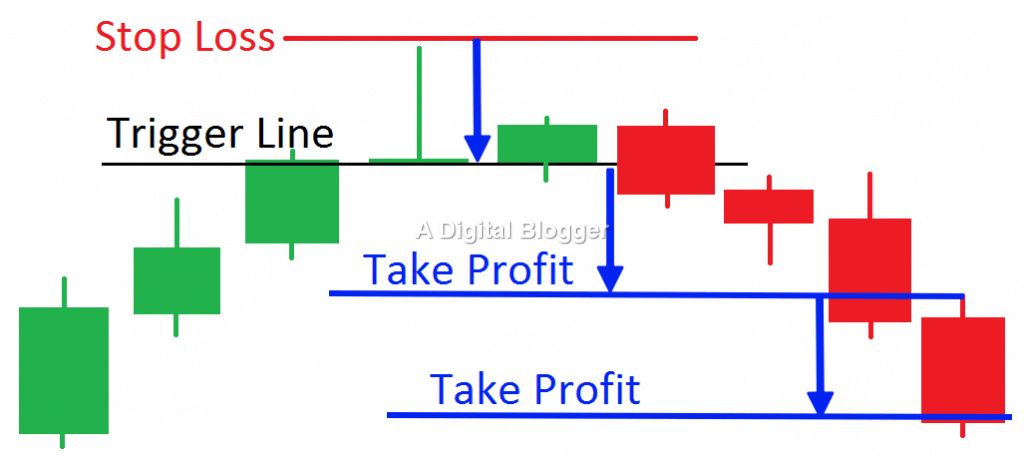
In a typical Gravestone Doji formation, the bearish form of a reversal pattern follows a price increase. At this point, a trader may look for a short signal on a candle after this candlestick pattern formation by identifying a break and close under the trigger line.
A Gravestone Doji is characteristic of many types of candlestick chart trends.
A trader may come across the bearish Gravestone Doji with an increasing price trend ending in a reversal candlestick of Gravestone doji type. In this type of trend, a trader may choose to open a short position when the candle after the doji breaks the trigger line.
To be profitable, a stop loss is assumed above the high date point of Gravestone doji. In other cases, a stock with a descending trend line may continue to go low when the target is reached. One may assume that the initial target is at a distance that is two times the size of the doji pattern. Although the price may go back to the initial target, a trader may pause until more profits are incurred. Yes, that will certainly be a safe play.
Apart from the way the discussed candlestick pattern works and how it is formed, there are several other aspects a trader needs to be aware of while using such patterns:
Gravestone Doji: Managing Risk
The most important aspect of trading with Gravestone Doji is to find the precise position of the stop-loss order.
The goal of a trader is to protect capital.
In this pattern, the stop-loss is placed above the high data point of the Gravestone doji candlestick. The risk level for a trader depends on the wick of the Gravestone doji candlestick. The tricky part about this chart pattern is that when a target is absent, a trader may find it difficult to realize a substantial profit.
Gravestone Doji: Setting Profit Targets
Similar to any other candlestick chart patterns, a trader must specify an exit target to make a profit early using Gravestone Doji.
A Gravestone Doji may have several potential targets.
One of the recommended profit targets is equal to the size of the Gravestone doji. A second strategy is to set up a profit target that equals double the size of Gravestone doji candlestick.
To get a good idea about the kind of profit target which is right for a specific Gravestone Doji, a trader may consider the size of the doji and the volatility of the chart. In case a trader chooses to go with the first target which equals the size of the doji, it is a good idea to either exit or waits until the second target is achievable.
Gravestone Doji: Key Trading Considerations
Let’s take a breather here!
Now, everything looks all straightforward BUT (there is always a ‘but’), while trading using Gravestone Doji, traders may look at a few key considerations as well.
The first indicator is the shadow of Gravestone doji. When a trader finds a long upper shadow for the doji candlestick, it indicates the price increase and an inability of the market to consolidate. The new high could not be retained and return to the low for the day. All these are indicators are a warning of bearish dominance.
Swift movement of an uptrend is another sign presented by a gravestone doji. A retracement is warranted in this case before achieving new highs. This indicates indecision and can present a warning about a bullish pullback or even further price consolidation.
Learn More: Pullback Meaning
Therefore, a gravestone doji that forms after a rapid increase in price is a significant sign for investors as it may hint at a reversal to accommodate the new price levels.
This chart pattern represents a single candlestick as opposed to a series. Prior to selling a long position or making a short move, trend analysis is important to estimate the strength before making a trade move. If a position of strength is not guaranteed, a trader may try to sell off when a bullish trend is prevalent, and this may not be the ideal strategy.
Some key signs to identify before trading are the presence of an uptrend, the shadow position, and the price channel.
Another important sign is price consolidation subsequent to a bullish breakout. In certain cases, this doji pattern may have a bearish candlestick next to it. In case of an unclear situation, it is prudent to wait for a bearish reversal confirmation before initiating selling to expect more price falls. A gravestone doji may also be spotted in a downtrend with a bearish dominance.
In such cases, traders may expect a continuation of the bearish sentiment as opposed to a reversal.
In conclusion, Gravestone Doji indicates a random behavior of the market or a scenario of indecision. The indecision in the market space could be a signal for possible continuation, consolidation, or a trend reversal. Trading with the doji depends on either the hourly chart or a daily chart.
However, this is not a limitation and dojis can appear on any chart pattern. Overall, Gravestone doji is a profitable pattern for traders.
In case you are looking to get started with using such trading chart patterns or generic stock market investments, let us assist you in taking the next steps ahead:
More on Share Market Education
In case you are looking to learn more about Chart Patterns, here are some reference articles for you:
Summary
Reviewer
A Digital Blogger
Date
Broker Name
Gravestone Doji
Overall Rating
