


Looking for Low Brokerage, High Margin & Free Tips?
Piercing Pattern
| | Chart Patterns | No Comments
More Chart Patterns
Piercing pattern is a bullish reversal pattern and is found towards the end of a downward trend. Its bearish equivalent is the dark cloud cover pattern with a bullish candle depiction on the first day and a bearish candle for the second day.
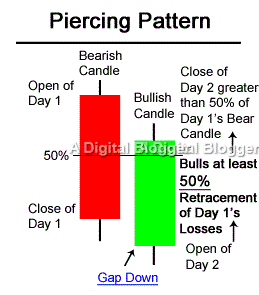
The complex piercing candlestick pattern contains two candlesticks. The first candle in this arrangement is bearish and the second one is bullish.
But is it that easy to identify during your technical analysis? Or there are some complexities involved?
Let’s try to find answers to these crucial bottlenecks so that you can start using these candlestick patterns in your trades on a regular basis.
Piercing Pattern – Introduction
When a sharp price rise is experienced in an otherwise docile market condition, the piercing candlestick pattern is formed. In this pattern, a falling darker shaded candle is followed by a lighter shaded candlestick which represents a trend reversal.
Initially, the downward trending market features an opening price at a high and selling activity proceeds as usual. Towards the end of the time period or the day, the closing price reaches the bottom for that time period. As a result, a bearish black candle is formed which represents the first candlestick of the piercing candlestick pattern
The opening price for the next day falls below the low point of the preceding bearish candlestick. Short rates are taken on by sellers. An increase in demand is witnessed as momentum decreases and prices start to rise.
The bearish trend swells up and selling happens at an aggressive pace and a higher price. On the flip side, the bulls start to accumulate a large proportion of shares at low prices. In due course of time, demand reaches over and above the supply threshold, and prices are pushed up.
Short sellers face losses and start buying back to curtail the losses incurred.
The bears who have taken on short positions experience profits. Bulls continue with their long positions and prices continue to rise. Towards the end of the session for the day, the closing of prices is way above the opening. This can be graphically represented using a bullish white candlestick as a second candlestick of the piercing pattern.
A valid piercing pattern signal follows when the close penetrates into the preceding black candle’s body.
Piercing Pattern – How to Use it?
In a piercing pattern candlestick, the market control is with the buyers.
The close cuts its way through the mid portion of the darker candle. A bullish signal can be easily perceived in this candlestick pattern. Downward moving prices in this bearish trend do not seem to be favourable.
However, price trends turnaround drastically as bulls start participating aggressively.
Eventually, prices close at a high for the next day. Although the price decline for the previous day is counteracted by the bullish activity, the bearish market forces do not get wiped out completely.
Investors must look out for a few characteristics pertaining to the trend reversal in a piercing pattern.
Firstly, the length of the candles determines the force with which the trend reversal takes place. As the gap down between the darker candle and the lighter candle widens, the more powerful trend reversal is expected.
A more powerful form of reversal is apparent when the lighter candle closes on the darker candle at a higher point.
Lastly, the downtrend and the reversal are both more important for stock traders when the darker candle has a larger body.
A piercing pattern may manifest itself in a number of ways. When a state of indecision in the market space is followed by a sharp price drop in the form of a bearish trend, a bullish piercing pattern may appear.
This means that although the price opens below the darker candle, it progresses upward, and is depicted by a longer and a lighter candle. The likelihood and strength of the reversal depend on the length of these candles.
Sometimes, a bullish piercing pattern may not necessarily be preceded by a sharp downtrend. The bullish piercing pattern may actually be situated after a weak uptrend. However, once the price cuts through the bearish sentiment, a strong uptrend is spotted on the trend line.
It is also important to understand that a bullish piercing pattern that occurs after a sustained downtrend and is followed by a single darker bearish candle may be confusing for the investors who may perceive it as a confirmation of the upcoming market sentiment.
However, due to the piercing nature of the price, a swiftly rising bullish uptrend may be observed shortly afterwards.
Piercing Pattern – Ideal Trader Position
When traders encounter the piercing pattern, it is best to wait until the high of the first candlestick is exceeded by its succeeding candlestick. This could be the ideal situation for taking a long position. The placement of a stop-loss is just below the low point of the first candlestick.
Such a strategy ensures that more odds are in favour of a successful pattern.
The piercing candlestick pattern is especially suitable for day traders and swing traders.
Candlestick patterns are good predictors of market conditions, and the piercing pattern serves as a good confirmation for a favourable market position.
The two common forms of trading variants which make use of the piercing pattern are momentum trading, and trading using the reversing chart patterns. When a piercing pattern is spotted after a large selloff and a certain decline in strength, it is perceived to be a more powerful pattern. However, there is a risk that it may take a runaway position.
Candlestick charts are useful for both long-term as well as short-term prediction of stock market sentiment.
The piercing pattern does well for day trading as well as in the case of larger time frames. The rate of success of the piercing pattern is quite high irrespective of the time frame chosen.
When using a piercing pattern, it is a good idea to look at previous price reversals. You may also spot piercing candles when small price peaks happen. Such instances can be ignored as the volatility of prices. When looking for a viable piercing pattern, the bottom of the market rhythm must be evaluated.
In case you are thinking of getting started with stock market investments or trading, let us assist you in taking the next steps forward:
More on Share Market Education
In case you are looking to learn more about Chart Patterns, here are some reference articles for you:
Summary
Reviewer
A Digital Blogger
Date
Broker Name
Piercing Pattern
Overall Rating
