


Looking for Low Brokerage, High Margin & Free Tips?
Scalping Strategy
| | Trading | No Comments
More on Online Share Trading
When a trader is following the trading style of scalping, they must stick to the scalping strategy in order to meet their financial goals. To help you walk through the rough terrain of these strategies, we will explain them in detail.
But before that, let’s understand what scalping is?
Scalping is a trading style where the trader makes profits fromexp the minutest changes in the prices of financial security. This is considered one of the best methods to achieve financial objectives by doing goal based investing in India.
The trader must have a strict exit strategy while using this style to minimize losses as one significant loss could eat up all the profits earned.
Therefore, the trader must have the most suitable tools to avoid missing out on any profitable opportunity just because of a scarce resource.
Further, the trader must have the stamina and patience to place multiple trades in less than a minute.
Now, let’s discuss the various scalping strategy that can be used while trading in the share market.
Scalping Strategy Trading
Scalping is a trading style that requires exceptional planning and strategizing every second of the market movement. The scalping strategy varies with the time gap the trader aims for and on the trading segment that is traded.
Based on time, there are three significant types of strategy – 1-minute scalping strategy, 5-minute scalping strategy, and 15-minute scalping strategy.
Further, based on the trading segment, we will discuss three of them – forex scalping strategy, options scalping strategy, and scalping strategies futures.
So, without any further delay, let’s go!
1 Minute Scalping Strategy
When you trade in the short run, you must have a strategy for entering and exiting the markets. It is essential as every second makes a difference in your trading positions. Slight negligence could incur huge losses.
Thus, this segment talks about a 1-minute scalping strategy. Let’s get going!
This scalping strategy uses two moving averages – 50 Period Exponential Moving Average and 100 Period Exponentially Moving Average and one oscillator – Stochastic Oscillator set at (5, 3, 3).
The three steps of this strategy are as follows:
1. Identify the Short Term Trend
The moving averages listed above are used to identify the current trend in a 1-minute timeframe. The first one calculates the average price of a security in the past 50 minutes, and the latter does it for the last 100 minutes.
The 50 period EMA is faster, and when it crosses above the 100 periods EMA, it reflects that the average prices are rising, which will lead to an uptrend. Contrarily, if the cross is below, it signals a drop and a short-term downtrend.
2. Wait for a Pullback
As the short-term trend is determined based on the trend shown in the 1-minute chart, it is time to wait for the pullback to occur in the moving averages. By the way, make sure you understand the pullback meaning before you start using it.
It is crucial as the prices have a tendency to return to the mean value after a strong up or down move.
This wait for a pullback prevents you from entering into a long or short position just after a substantial price change has occurred. Profit-taking activities often lead to fake signals and losses.
3. Wait for Stochastics Indicator to move
This indicator is the last filter in the decision to place a trade. It helps you in taking only high probability trades. The Stochastics Indicator oscillates between 0 to 100, according to the strength of the recent price movements.
When you see a reading of more than 80, it means that the recent price jump is substantial, and a down move is expected. It also signals the security is overbought.
Contrarily, a reading below 20 signals that the recent down move was strong enough to expect an uptrend, and this situation is known as oversold.
As the pullback of EMAs is completed, the Stochastic Indicator will move towards overbought or oversold.
Now, let’s talk about the 5-minute scalping strategy.
5 Minute Scalping Strategy
The 5-minute scalping strategy is commonly known as the 5 Minute Momo Strategy. This strategy helps forex traders play reversals and stay in the position as the price trends in a new direction.
The trader looks for a momentum or ‘momo’ burst in the short-term charts like that of 5-minute charts following this strategy.
First of all, they lay two technical indicators – Moving Average Convergence Divergence (MACD) and 20-period Exponential Moving Average (EMA).
The strategy waits for a trade reversal but takes advantage only in the situation of a strong momentum that is enough to create an enormous extension burst.
Further, as the trend unfolds, stop-loss orders and trailing stops protect your profits.
EMA is given preference over SMA as it gives higher weight to the recent movements, which is extremely important for fast momentum trades.
But, since the strategy is dependent on technical indicators, results vary according to the market conditions.
You can exit the trading position in two segments. The first half will help you lock in gains and ensure that a winner is not turned into a loser.
The second half attempts to catch the probable large move with no risk as the stop has been moved to breakeven.
Moving forward, let’s talk about the last time-based scalping strategy – a 15-minute scalping strategy.
15 Minute Scalping Strategy
The 15-minute scalping strategy is divided into four steps:
Setting Chart
Following a strategy that is heavily dependent on the chart, it is crucial to set the chart at the right conditions to reap the best of them.
We will use the following indicators for this chart setup:
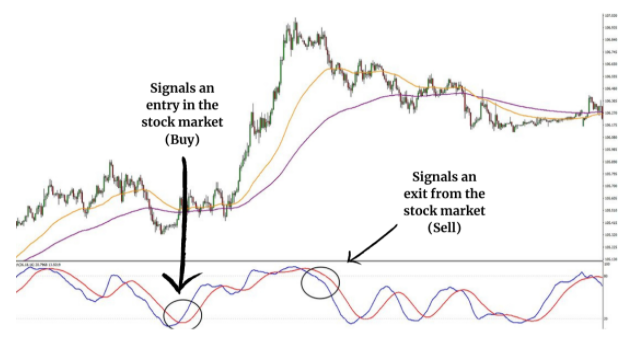
- The 120 EMA (purple in the chart below) and the 50 SMA (orange in the chart below).
- Stochastic with the parameters set at – slowing 16.0, %K 26.0, %D 18.0.
With this said, let’s talk about the trading strategy.
Buy Trading Strategy
According to the chart shown above, you must proceed to buy only when both of the conditions exist. The conditions are a follows:
- It is a clear buy signal when the fast blue line of Stochastic Indicator crosses the slower red line to the upside from the inside of the oversold region, i.e., below 20 level on Stochastic.
Once the line breaks and remains above the oversold region, proceed to buy the financial security.
- When a bullish pressure exists, it is another buy signal. It can be seen by the 50 SMA line crossing the blue line of the 120 EMA to the upside.
To save your trade from risks, you must place your stop loss at about two pips below the support levels.
When To Sell
Executing the trade at the right time is essential to make the best out of that trade and maximize profits while minimizing the losses. Below are the conditions you must observe to choose the perfect time to sell off the financial asset:
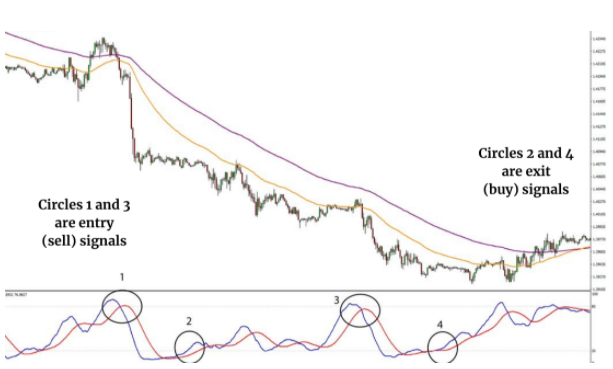
- When Stochastic’s blue line crosses the red line to the downside and from inside the area above the 80 level, it should break and remain below the said level.
- If the 50 SMA (orange line) goes across the blue line of the 120 EMA (purple line) to the downside, it is a sell indicator. It indicates that the market is going through selling pressure.
The chart is shown below:
Exit Strategy
Exiting a trade at the most favorable time decides the success of a trade. Thus, when you observe any of the following conditions being met, exit the trade accordingly.
The conditions are:
- The exit signal for short traders is when the blue line of the Stochastic indicator crosses the red line from the inside of the overbought region, and the exit signal for long traders is when the same happens in an oversold area.
- Another exit signal is when the 50 SMA indicator line crosses over the line of 120 EMA from the bottom up in the middle of a bearish trend or from the top in a bullish trend. This price movement indicates that the existing trend is starting to lose its strength.
Therefore, the trader must exit the trade to earn profits.
Now, let’s talk about the scalping strategy for specific trading segments like Forex, Options, and Futures. First up is Forex Scalping Strategy.
Forex Scalping Strategy
The forex scalping strategy is used to maximize profits while trading in the currency segment of the share market. Since currency is highly volatile segment. Therefore you should know how to do Scalping Forex. There are seven strategies to follow to increase the profit margin.
The profits are not expected to be in massive amounts. Following this trading style, a trader will execute the trade after registering a gain of 5 to 20 pips.
Below is the seven forex scalping strategy, you must know about:
Picking More Volatile Pairs
A significant factor in the scalping strategy is to pick the highly volatile pairs of currency. Now, since this trading style requires quick gains, the market has to keep up with the pace and move faster to produce the desired results.
The currency pairs with lesser volatility are generally not so useful as they take much more time in fluctuating their prices. This would translate to the trader having to wait for half an hour or more to reach his desired levels of price.
Some volatile currency pairs are GBP/AUD, AUD/JPY. The prices of Gold and Silver also experience a considerable degree of variation during a trading session.
Avoid Brokers with Dealing Desk
It is a universal fact that when you choose a stockbroker, you should go through various aspects to find the best and the most suitable one. However, this becomes even more important for a trader that does scalping trading.
In this trading type, the success of a trade is heavily dependent on the execution of the trade, which is just a matter of seconds here. Therefore, try to avoid a broker with a dealing desk as they might reject the order execution.
The rejection can be highly harmful if the markets are going in a direction, plunging or rising, against your expectations. The profit could be wiped out in a moment because of this and would have to incur heavy losses.
Choosing Pairs with Lowest Spreads
Forex scalping strategies work on small gains like 5 to 15 pip gains and not massive profits in just a trade or two. Therefore, a wider broker spread can conveniently eat up significant portions of a trader’s payout.
It means that the broker and the currency pair must be chosen after detailed research to avoid any last-minute trading hassles.
Using Bollinger Bands
Traders use a convenient scalping indicator known as the Bollinger Bands. The markets are settling down for a tight range trading when the Bollinger Band line becomes flat.
This scalping strategy in forex is straightforward. The trader buys a currency pair when it moves closer to the lower bound and sells it when its price is getting closer to the upper band.
Following a strategy never guarantees the success of all the trading positions, but it certainly helps you succeed in a majority of the trades.
Execute Trades Manually
It is generally suggested in various webinars and manuals that a forex trade be executed using a stop-loss order. But, a forex scalping trade is an exception to this prevalent suggestion.
The exception is due to the time lag of setting one. When you put a stop-loss order, it takes a few seconds that might change the price by several pips. Further, this exception has a small condition attached to it.
If the trade duration is 1 to 15 minutes, the trader must keep an eye on any significant price fluctuations. Contrarily, if the time frame is ranging from days to weeks, you must put a stop loss to minimize the risk of market volatility.
Because of these conditions and exceptions, a trader chooses the suitable method. However, the majority of them decide to execute the trades manually.
Use Simple Moving Averages
After all these varying strategies, let’s now talk about the technical indicators that are a part of the forex scalping strategy and can be a helping tool.
Simple Moving Average (SMA) and Exponential Moving Average (EMA) are the two necessary tools.
The traders use varying periods like 5, 10, 50, 100, or more for SMA or EMA according to their preferences. One way to look at this is to open positions according to the direction of the moving averages.
It is evident that the long-term trades would require more in-depth analysis, but the short-term trades, like that of 1 to 15 minutes, might yield you profits.
It is not among the best forex scalping strategy, but it does work for many traders.
Trading Support and Resistance
Although this strategy is not the best scalping strategy for forex, it is quite simple to implement. It is similar to using the Bollinger bands but here, you keep an eye on the support and resistance of the corresponding financial security.
To find out these levels, you don’t need to carry out any detailed analysis. In fact, most of the Forex news websites publish the three resistance (R1, R2, and R3) and support levels (S1, S2, and S3).
Generally, the marks of R3 and S3 are considered to be stronger and are more likely to hold the line. This option might be viable in the long run, but it is very useful for short-term traders.
Now, let’s discuss the options scalping strategy.
Options Scalping Strategy
Trading in the options segment is tricky anyway, and using scalping to earn profits requires discipline, decisiveness, discipline, and analytical prowess. You must be very clear while choosing a strategy to avoid any hassles.
Thus, here are four options for scalping strategy to guide you. They will lead you towards a successful trade in the segment while practicing the scalping trading style.
The strategies are as follows:
Stochastic Oscillator Strategy
This momentum oscillator is used to compare the current price of a financial asset to a range of its price over the desired period. It has a range of zero to 100 and aims to capture the moves of the trend.
When the %K line crosses the %D line from below and an upper movement in its price, the trader should open a long position. Contrarily, when the %K line crosses %D from above, the trade should be exited.
Parabolic SAR Indicator Strategy
This indicator tells you about the market direction and provides you with entry and exit points. SAR stands for Stop And Reversal, which is a series of dots on the price bars. The trader has an edge as it tells you the movement of the underlying.
When a security price rises, the dots also move accordingly. The dots placed below the price bar depict a bullish trend, which means the trader should open a long position.
Conversely, if the dot position flips, it signals an upcoming trend change.
Thus, the change in position of the dot depicts trend reversal is underway.
Moving Average Strategy
Another strategy is to use the moving average lines. Generally, the traders use a long-term 200 period MA in combination with two short-term MAs for decision making.
When the long-term MA rises and the 5-period line crosses above the 20 periods in the direction of the trend, traders should take a long position. Conversely, when the long-term MA dips, traders take a short trading position.
RSI Strategy for Intraday
RSI stands for Relative Strength Index, which is a popular oscillator. It is used in varying timeframes. Scalpers adjust it for the required timeframe and then pinpoint the entry and exit points of their trades within a trend.
As the RSI moves close to 30 and climbs upward, it indicates the traders to open a long position. On the other hand, if RSI moves closer to 70 and then dips, it creates an opportunity to sell the financial security.
With all the options scalping strategies discussed, let’s move ahead to the scalping strategies futures.
Scalping Strategies Futures
The scalping strategy for the futures segment is necessary to avoid any chaos while trading in the share market. Since scalping is short term trading with quick entry and exit, it is crucial to have a clear idea about the best indicators for Day Trading Futures.
A confused trader might have to incur losses and lose out on many fantastic opportunities to maximize profits. Thus, below is a list of the few most commonly used scalping strategies futures.
Let’s begin!
Breakout Trading Strategy
First, we need to understand what a breakout is?
When an asset’s price moves outside the predefined area of resistance or support, a breakout occurs. The trader hopes that enough momentum is there behind the push to tick the security prices up or down. (tick is the measure of movement in the futures market)
Further, the tick has to be long enough for the trader to enter the market and have a profitable exit. Generally but not always, a good breakout has the following characteristics:
- A substantial volatility increase succeeds the contracting volatility during a breakout.
- An increase in the trading volume on a breakout.
- It touches the Support or Resistance multiple times.
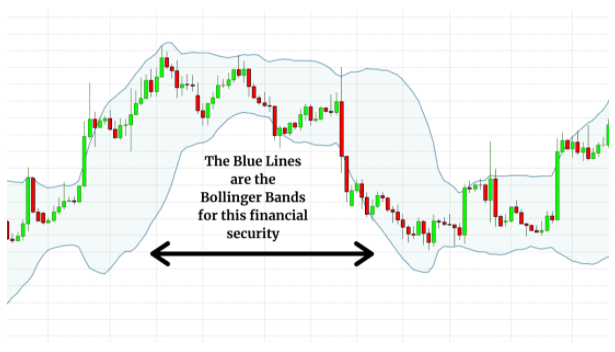
Trading With Bollinger Bands
Bollinger Bands are an essential indicator in the share market that are like envelopes. They are two deviations above and below the simple moving average of a security’s price and creates a roadmap for the traders that can be used to implement the simple scalping strategy.
One of the most straightforward applications of these bands is scalping when the price hits either of these bands. So, if the price hits the top band, go short and if it hits the bottom band, go long.
Ideally, the position should be held until the trade hits the opposite band, where the market is considered ready to reverse itself.
A chart with the depiction of Bollinger Bands is shown below:
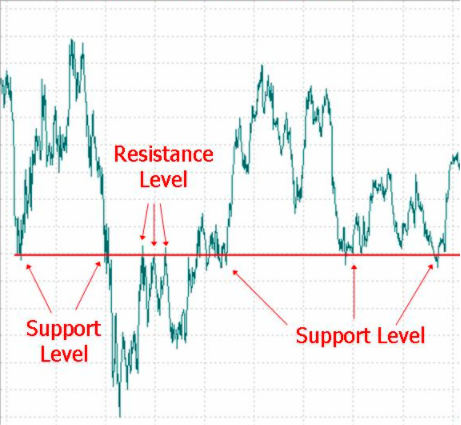
Trading Ranges
The traders who trade in index futures like S&P 500 E-mini and Micro E-mini look for medium volatility assets to trade. A moderate level of volatility helps them to avoid unexpected price movements.
Further, if a trader scalps in the middle of a trusted trend, it is highly probable that your share market prediction is accurate.
To be on the safer side know all the share market rules.
Before you commence a trade, you must identify the set of support and resistance levels. Once that is done, you buy and sell near these levels. This strategy can be followed till a breakout occurs.
Post this; you have to wait for the new support and resistance levels. A chart depicting both of them is as follows:
Best Scalping Strategy Indicator
Indicators play a significant role in deciding on the trading strategy. Scalping is heavily dependent on the trading strategy chosen by the trader. This means that an in-depth knowledge of the relevant indicators is mandatory.
Thus, here is a list of the four best scalping strategy indicators that will guide you towards a more robust strategy. But before using these indicators, make sure you follow the Scalping rules.
Let’s go!
SMA Indicator
The SMA indicator or Simple Moving Average Indicator is a primary indicator that is relied on and used by the traders to devise a trading strategy. Its function is to show the traders the average price of their trading assets over a designated time.
The indicator helps the traders understand the market trend of their securities, foreign exchange, commodities, etc., i.e., if they are moving up or going down. Therefore, market trends are identified.
SMA indicator is considered to be an arithmetic moving average. In this indicator, to calculate the average, traders add the recent closing prices and then divide the obtained price by the number of periods.
EMA Indicator
The EMA indicator or Exponential Moving Average indicator is the next scalping strategy indicator. It is quite useful as it enables the traders to give more weightage to recent prices.
The difference between EMA and SMA is that SMA gives equal weightage to all the values.
It is considered among the best indicators for positional trading as it has a quicker response to the new price changes than to the older price fluctuations.
The indicator is used to obtain and sell signals from the crossovers and divergences of their historical averages.
To make the right use of this, it is important to know best EMA for intraday and scalping.
MACD Indicator
The MACD indicator or Moving Average Convergence Divergence indicator is a popular one among the traders. It is suited to a range of traders as it helps in understanding the momentum of the security and following and capturing the trends.
The MACD indicator depicts a relationship between the two moving averages of the price of financial security.
The MACD scalping indicator is calculated by the traders by subtracting the 26 days EMA (Exponential Moving Average) from the 12 days EMA, with the 9 days EMA set as the default setting or signal line to mark the buy and sell triggers.
This is the default setting of the indicator, for better results, it is better to understand the best MACD setting for intraday or scalping that can help you in understanding the sensitivity of the trend.
Parabolic SAR Indicator
The Parabolic SAR indicator or Parabolic Stop and Reverse Indicator is among the best scalping strategy indicators as it shows the traders a trend of the price action. During an upward trend, the chart points are displayed below the price in this indicator.
On the other hand, during a downward trend, the indicator shows chart positions above the pricing. It signals the trader that the prices are retracting.
The traders determine a financial securities’ short term momentum, future and assists in understanding the correct time and place to put a stop-loss order with the help of this indicator.
It is most suited for times when the market has steady trends.
Is Scalping A Good Strategy?
After this detailed discussion about the trading strategies, asking a question like is scalping a good strategy is acceptable.
Want to know why?
That’s because you might understand a strategy but still be confused if you should implement it or not. That is where we come in to guide you towards an unbiased decision.
It is highly recommended for traders who wish to trade and earn small margins of profits in our viewpoint. These small gains add up to be a considerable amount at the end of the trading session.
Since scalpers place and execute multiple trades in a single day, the gains are magnified or diminished based on their decisions.
It also translates to a trader using multiple and varying strategies that will help him identify the market trends and act accordingly.
These strategies are listed and discussed in great detail as they are categorized based on the trading segment and the timeframe chosen by the trader. Further, there is a long list of indicators that can be used y a scalper.
The most used and best scalping strategy indicators, like SMA, EMA, MACD, and Parabolic SAR, have been discussed in detail.
We hope this detailed article has helped gain insights into a range of scalping strategies.
Merry trading!
Wish to start trading in the Stock Market? Refer to the form below
Know more about Share Market