


Looking for Low Brokerage, High Margin & Free Tips?
Option Trading Indicators
| | Derivatives | No Comments
More on Derivatives
Volatility is back in the market, and as an option seller, you couldn’t ask anything better than this from the market environment. Over the next few minutes, we will be discussing the best indicator for option trading.
“The trend is your friend but the fade is the ultimate wealth builder.” – Tom Sosnoff.
Many times we have seen that new investors or traders tend to dig into a toolbox whenever a new widget arrives in the market or whenever they find something really mesmerizing.
They follow different trending patterns without understanding what’s actually the bit fit for them and which indicator they should actually choose.
To make it the journey easier here is the list of best indicators for options trading;
Best Indicators for Option Trading in India
There are such good indicators available in the stock market that can be profitable when doing option trading. But, before learning about them, let us have a look at the meaning of indicators.
Typically, indicators are a subset of technical indicators and majorly consists of formulas and ratios. It’s a quantitative tool that is used by traders and investors for stock market prediction and for the analysis of the future movement of an underlying asset.
Indicators show the current top gains and losses in stocks as well as in indices so that one can forecast the market movements.
Now, let us discuss a few technical indicators for option trading, but wait! How can we miss the information about option trading?
So, what do you understand by option trading?
Option Trading is a broader term used in the investment sector, just like equity, commodity, currency, etc.
However, it’s different from other segments since it’s a kind of contract that gives a right but not an obligation to the buyer and seller to execute the trading deal within the timeframe or validity of the contract and at a fixed price.
Now options are risky but the correct analysis by choosing the best indicator can help you to an extent to reduce the option trading risk.
Now, it’s time that we must begin with a list of some of the best Technical indicators used for option trading.
List of Option Trading Indicators
The five Best Indicator are used by trader for technical analysis for options trading:
- RSI or Relative Strength Index
- Bollinger Bands
- ADX Indicator
- Money Flow Index (MFI)
- Put-Call Ratio (PCR) Indicator
We know that understanding each of these may seem like an eternity, but trust us, you won’t regret it! So, let us give each of them a quick shot one by one.
-
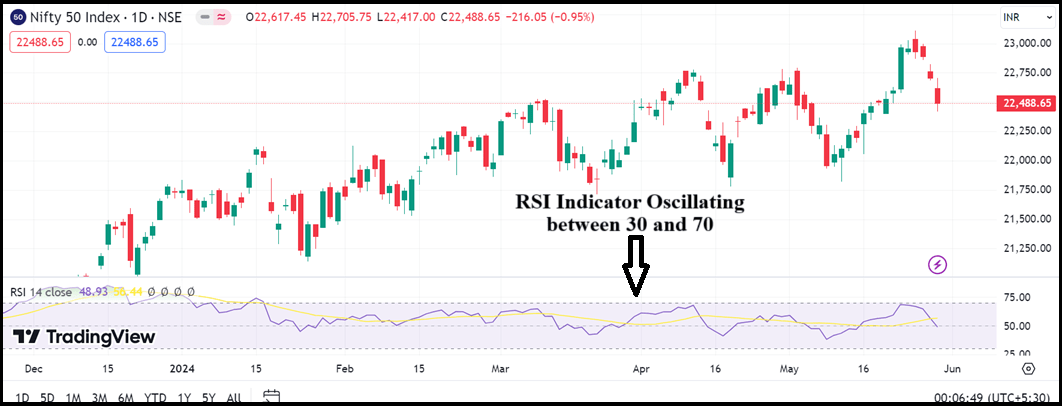
RSI Indicator for Option Trading
RSI or Relative Strength Index indicator is one of the best indicators for option trading as well as one of the best indicators for positional trading which is used mostly by momentum traders.
- Basically, it compares the intensity of recent gains to recent losses over a particular period of time prevailing in the stock market.
- This is generally done to calculate the speed of the underlying asset and change in the price patterns or movements to know whether they are oversold or going through the overbought condition.
- The value of the Relative Strength Index (RSI) ranges between 0 to 100. If the RSI value of a stock or any underlying asset is below 30, then this indicates the oversold levels. However, if the value is more than 70 then it is considered as an overbought level.
- Value 70 > indicates an overbought level
- Value30 < indicates an oversold level
- RSI is the best indicator for option trading and best suited to determine momentum in index.
-
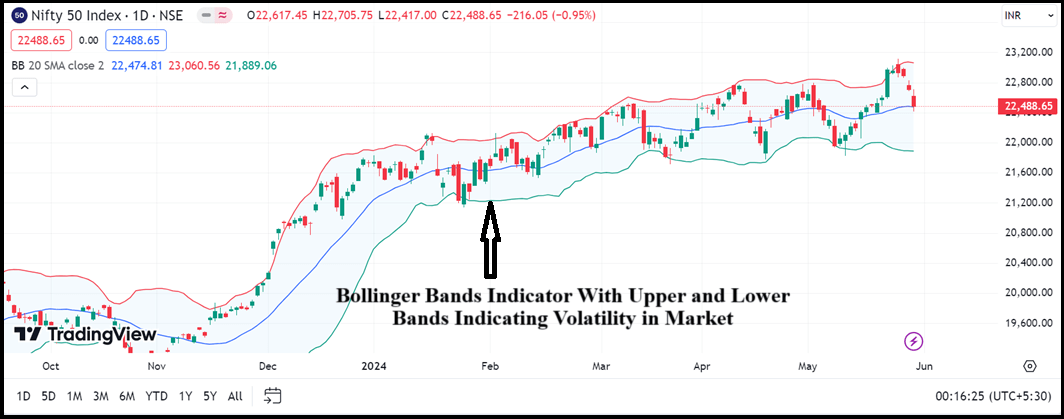
Bollinger Bands Indicator
Not all option traders know the significance of the volatility and a few of the chunk who knows preferably use Bollinger Bands to calculate the volatility of a stock.
Here are some of the top features of the indicator:
- The major feature of this best indicator for option trading is that it enlarges as volatility in the underlying asset increases and tense up when the volatility falls.
- It is believed that the closer the price moves to touch the upper band, the more chances of that security to be presently overbought.
- On the contrary, if the underlying asset’s or security prices move towards the lower band, then most of the investors view it under the oversold level.
- On certain occasions, if the price has moved outside the bands’ area, then it’s a signal for the option traders or investors that the security is completely ready for reversal, and they can position themselves according to the scenario.
- Also, it is vital to note that it’s a wiser decision to sell options when the market volatility is high as the value of the stock will be also higher in such cases.
- If you wish to buy options, then choose the periods of low volatility when the options are sold at a cheaper rate.
The bollinger band indicator thus helps in determining the current volatility of the market. In such a case, it is a useful indicator for option buyers as they lose maximum money by trading in the sideways market.
Along with this an option trader can minimize their risk by keeping a track of their trades in one of the renowned apps, Samco Trading app.
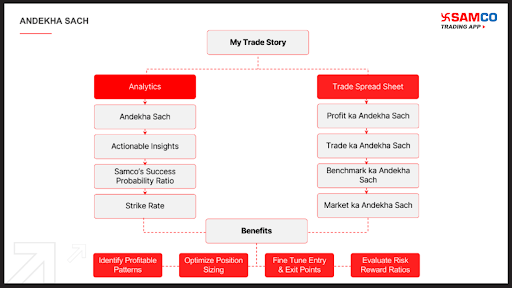
The app provides a feature with the name ‘My Trade Story’ which reveals the Andekha Sach of your trades.
The feature highlights your total profitable and loss making trades and generates a probability success ratio that makes it simpler for you to determine your level of trade.
Not only this, on the basis of the score it provides the ways that help in improving your trade results as well.
-
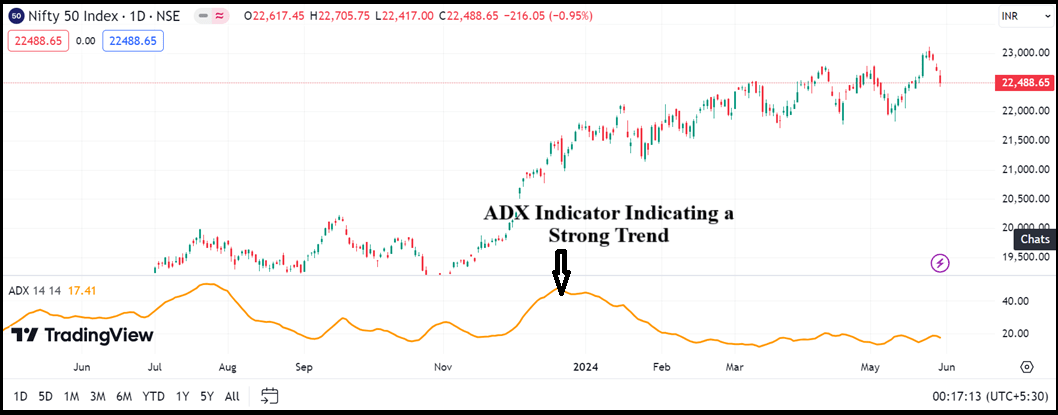
ADX Indicator
Coming to our next best option trading indicator, ADX or Average Directional Index that tells the strength of the trend.
An option trader can use it to determine whether the market is trending or sideways.
Also, the indicator gives the signal of upcoming reversal in the market.
Here are some of the prominent features of the indicator:
- The indicator oscillates in the scale of 0-100 where different values gives different indications of the strength of the trend.
- ADX value below 25 indicates a weak trend.
- The value of the indicator between 25-40 gives an indication of moderate strength
- Above 40, the strength is strong as one can take a position in option trading accordingly.
For example, if the trend is moving in an upward direction with the ADX value 50 this indicates the strong bullish trend.
In such cases the trader can take a buying position in call option or selling position in put options.
Also, it is important to note that the ADX indicator only tells about the strength not the direction of the market.
-
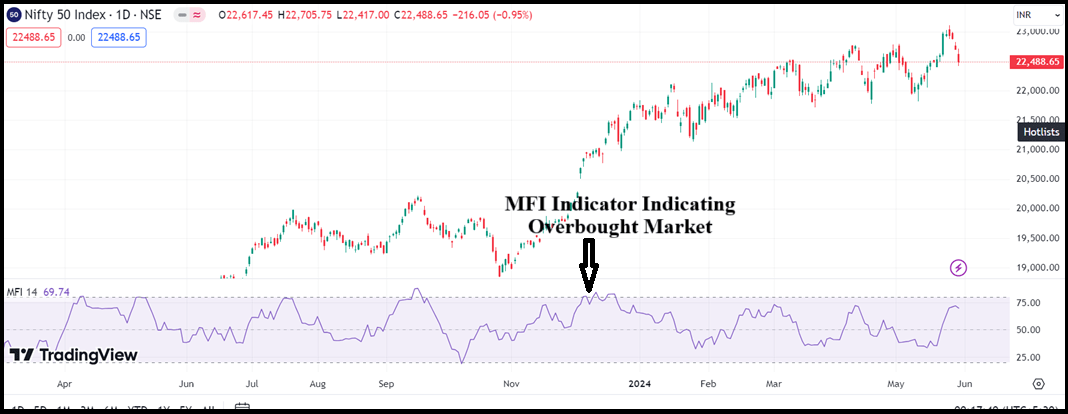
MFI Indicator
Now, let us have a look at the other best indicator for option trading known as MFI or Money Flow Index.
Some of the key highlights of this technical indicator are listed below-
- It is an important momentum indicator that includes both stock cost and volume information and after combining them, share the accurate information for the option trader.
- This concept is also known as Volume Weighted RSI and is an indicator of “exchanging pressure.”
- The MFI or Market Flow Index is a technical indicator that quantifies the inflow and outflow of cash into an underlying asset throughout a particular timeframe. Typically, this time frame is of 14 days.
- The formula to calculate the Money Flow Index is given as below:
MFI or Money Flow Index = 100-100 / 1 + Money Cash Flow
- Here, Money Flow Ratio is the 14 period positive (+) money flow divided by 14 period negative (-) money flow.
- If the outcome of the above-said formula comes more than 80 then this clearly demonstrates that a security is overbought, while a perusing under 20 shows that the security is oversold.
- Further, if the underlying security or asset’s value is between 80 to 20, then it is normally bought and sold in the market.
- Because of dependency on the volume information, Money Flow Index is more qualified for stock-based option trading (rather than index-based) and longer-length exchanges.
- While trading, at the point when the MFI moves the other way as the stock value, this can be the main pointer of a pattern change.
Now, let’s commence with the next technical indicator that can be helpful while trading in options segment.
-
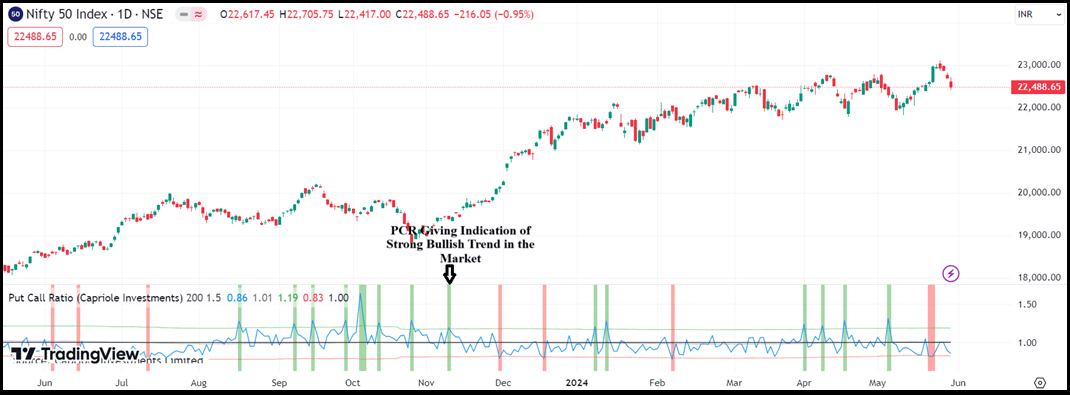
Put Call Ratio Indicator
Put Call Ratio Indicator also known as PCR estimates trade volume utilizing put options i.e bearish versus call options i.e. bullish. Rather than the total estimation of the put-call ratio, the adjustments in its value show an adjustment in the general market assessment.
A score of .7 obtained in the average put-call ratio is known to be a fine basis for assessing sentiment.
- When there are a larger number of puts than calls, the proportion is over 1, demonstrating bearishness. At the point when call volume is higher than put volume, the proportion is under 1, signifying bullishness.
Conclusion
In addition to the aforementioned technical indicators, there are a plethora of different indicators in the option trading that can be utilized for better and wise trading such as cumulative tick, Stochastics, average true range, stochastic oscillators, and many more!
On top of those, varieties of other technical indicators exist in the stock market with smoothing procedures and a blend of different ranges to predict and analyse the stock.
Along with these indicators, there is option chain analysis that further makes your analysis simpler and helps you make trade related decisions.
Wish to start trading? For that, you need to have a demat account. Refer to the form below