


Looking for Low Brokerage, High Margin & Free Tips?
Stock Market Prediction
| | Share Market | No Comments
More On Share Market
Are you confused about which stock you should invest? Well! What if you are provided with the information that helps you in making a decision. Yes! You heard it right. Stock market prediction can help you in evaluating stocks and in determining the future movement of stocks.
Stock Market Prediction India
Stock Market Prediction is the most important strategy to consider before entering the stock market as it helps the investors to determine the foundation of any type of trade i.e. price.
In stock market prediction, a trader determines the future movement of the stock or other financial instruments value of a company that is bought and sold on an exchange.
An accurate prediction of stock price movement helps the investors to get more profits.
Stock Market Prediction in India involves two main analyses; Technical analysis and Fundamental analysis.
Stock Market Volume Prediction
Before predicting the Volume in the stock market and commodity market, one must know what this Volume is? Volume is an essential term for those who trade.
What does Volume show us? Here if we talk about any particular time frame, it can be one day that we call intraday, 30 days, or one year. It means how many shares of a specific company are traded within a particular time.
Let us understand Stock Market Volume Prediction with a table.
| Trader | Shares | Trade | Volume (Shares) |
| A | 1000 | 1 | 1000 |
| B | 500 | 2 | 1500 |
| C | 2500 | 3 | 4000 |
The above table shows that if trader A sells 1000 shares, the trade count will be 1 and the number of shares (volume) traded will be 1000. If other traders will also buy more shares, the trade counts and volume will also increase.
B sells shares 500 then the total volume will be 1500 (1000+500) and trade 2. At last, if one more trader C sells 2500 shares, here the volume will be 4000 (1000+1500+4000).
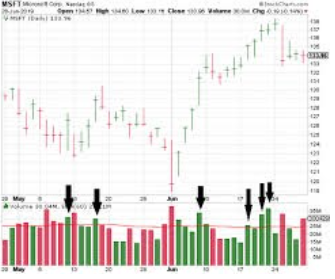
Here in the below chart, the red and green bars act as indicators that show the Volume of the stock traded.
Now let us understand, how does the Volume affect the market? If any share or commodity price is in an uptrend and its Volume is also decreasing, then it is estimated that share and commodity will be in the downward direction.
Similarly, if the price of any share or commodity goes down but its Volume is increasing. It shows that share and commodity will be in an upward direction.
Stock Market Volatility Prediction
Stock volatility depends on time, like how much time you want to know the stock’s volatility. If you want to learn stock volatility for one week, it is called week volatility, for one year; yearly volatility, and for a day; intraday volatility.
You should decide to stop the loss of stock according to its volatility. If you do not do so, your stop loss hits more, and you can earn fewer profits.
For example, the closing price of Bank of Baroda is Rs. 164.80, and its low price / Previous day low is Rs. 162.25/, and its Previous day high/high price is 166.30. Now we calculate the stock volatility so that we can set an accurate stop-loss.
There are numerous ways of calculating stock volatility, but here we explain an easy way.
However, this method is most useful for Intraday Trading.
The previous day’s low is the lowest traded price of the last/preceding time frame candle. Yesterday’s low. Whereas, the previous day’s high is the highest traded price of the last/preceding time frame candle. Yesterday’s high.
Previous day low – 162.25
Previous day high – 166.30
Now what you do, you have to subtract the previous day’s high price from the previous day’s low price that we will get Rs. 4.05 (166.30-162.25).
Difference = previous day high – previous day low
= 166.30 – 162.25
= 4.05 (Rs.)
Now you have to multiply this difference by 100 and divide it by the closing price of that day. So we will get 2.45%. Now, because this volatility is for a full day, from low to high we will divide it by 2. This calculation will give 1.22%.
Stop loss = (difference/close price)*100
= (4.05/164.80)*100
= 2.45%
= 1.22% (2.45% divide it by 2) only trade in this range
Thus the overall predicted volatility of the stock is 1.22%. Now if the stock opens at the price 1.22% less than the previous day closing price i.e., then it is highly recommended not to trade in the stock of Bank of Baroda.
However, if the stock price opens at ₹168 so you can buy it and set a stop loss somewhere between 165 and 167 (168-1.22%of 168= ₹165)
Stock Market Prediction Methods
There are multiple Stock Market Prediction methods for traders, investors, and analysts who stay keen to know the future value of individual stocks in the financial market. Here is the list of a few of them.
- Stock Market Prediction using chart patterns
- Stock Market Prediction using Machine Learning, Numerical and Textual Analysis and Linear Regression & Python
Let’s jump to each method one by one.
Prediction Using Chart Patterns
When a stock moves, it leaves a trail behind it that we call chart patterns in technical analysis. By studying the charts’ design, you can predict the future price of stock quickly.
Chart Patterns are of two types; the first one is a Bullish pattern that indicates that the stock price is about to go up from here. Another one is the Bearish pattern that says there will be a fall in stock prices from here.
The whole objective of technical analysis is to take decisions and a calculated risk not based on emotions but after reading these charts using your technical skills.
In this topic, you can get the detail of a most significant chart pattern, which is the Up flag Chart Pattern, which is frequently shown in Chart. After understanding this Chart, you can easily predict the price and direction of stocks. It provides bullish and bearish signals as well.
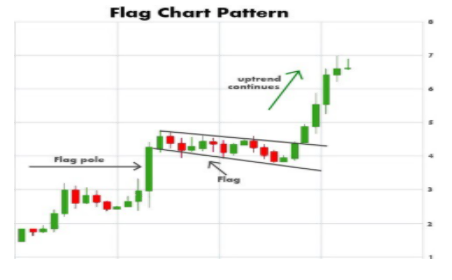
So first, let’s talk about the Up Flag Chart Pattern or Bullish Chart Pattern.
Here in the above chart, you can see an Up flag pattern. It is the most common pattern that is shown, especially in the Uptrend. It seems like a flag. For in-depth understanding, you need to look at it closely.
Here, you will find four parts in every chart pattern. The first part is the Historical Move, where you can see the flag’s pole and the history showing that this stock was in Uptrend.
The second one is Consolidation. Here stock moves sideways neither goes up nor goes down. You can find a flag cloth in this phase that means the investor leaves to interest this stock.
The third key phrase is Break Out, where the stock comes out from the Consolidation Option. It looks like a big candle in the Chart and shows that the investor comes back in this stock with rigorous Volume.
The last part is a Future Move that does not show in the Chart but has to be predicted by an analyst.
To illustrate, Graphite India showed Up Flag pattern, and our analysis was saying that stock was about to go up from here.
So we calculated its target, stop loss, holding period and recommended it for the delivery category. The buying price was Rs. 325, and the target was Rs. 600 within one year. So, let’s see whether the stock hits the mark or not.
On that particular date, the breakout of the stock price was Rs. 325. When we recommended it for two months after the present date, the stock price went up to Rs. 658, that means it doubled. So this was the magic of the Up flag Pattern. It assists in predicting the stock prices correctly.
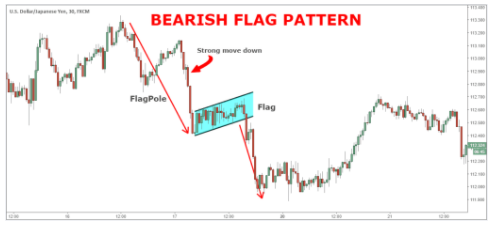
On the other side, if you get this pattern reversed, you will find a Down Flag Pattern or Bearish Pattern.
It shows that the stock price is about to go down from here.
Let’s understand it with an example, in Garvita, India, where a Down Flag pattern was identified on 26 February 2013. Here also, you can see the pole of flag cloth break out with good volumes.
This analysis shows that from here, the stock falls. The stock price was Rs. 125 and was estimated to go down to Rs. 60 within 3 months, that is half of the previous price.
But within 1 month, on 26 March 2013, the stock price fell to Rs. 31 is less than half of the estimated cost. This is the power of a Down Flag pattern.
One thing you have noticed here is that the stock price was estimated to be half of the previous price within 3 months, but this thing happened just in one month, how?
It shows that stock market prediction gives a direction. But it is not sure that stocks run as per your calculations. Even after predicting the Up Flag pattern, stocks can fall, or despite the Down flag pattern, they can rise.
Apart from this, you need to go through various fundamental parameters for stock market prediction, which involve;
- Experience
- Judgment
- Way of studying stocks
- Suitable time of looking stocks
- Understanding of economy and its sectors
Stock Market Prediction Using Machine Learning
Predicting the stocks’ future value might be one of the most challenging jobs to do before investing in the share market. But here are introduced various latest trends for evaluation such as software and machines which have made this task easy.
Long Short Term Memory
They provide better assistance in evaluating the share prices with a high degree of accuracy. Besides, they allow you to look over the insights that you can not see and evaluate quickly without such software as python.
Machine learning features:-
- Latest announcements about the company
- Historical stock prices of previous years
- Do evaluation based on the current value of stock indices.
- Show quarterly revenue results.
Stock Market Prediction Engines
There is a massive range of stock market prediction tools, but we have explained only two types of tools to predict the stock market. The first one is the Moving Average, and another one is the Relative Strength Index.
Moving Average (MA)
Moving Average is defined as a technical analysis tool used to evaluate the moving average of a stock. It is calculated using two ways; Simple Moving Average (SMA) and Exponential Moving Average (EMA).
SMA is calculated by taking the arithmetic mean of a set of stock prices over several previous days, like 15, 30, etc. In contrast, EMA is evaluated by the arithmetic mean of a group of stock prices in recent days.
Moving Average (MA) helps to determine the support level (price at which buyers tend to buy or enter into the stock) or resistance level (price at which a buyer leaves his position and takes).
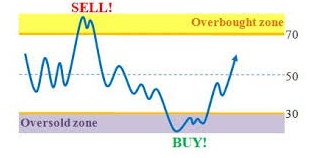
Relative Strength Index
RSI is the most used oscillator indicator that remains in a range from 0 to 100. For example, there is a range of 30 and 70.
Blueline is an RSI line; when RSI is below 30, it is oversold. In this case, you do not have to buy. In contrast, if it goes above 70, it is assumed as overbought, then you do not have to sell immediately.
Overbought does not mean it gets negative, and you have to sell it. Instead, you have to wait for the RSI to go below 70 (70 lines). Then you can sell it. Similarly, if your RSI is above 30, you can buy it, but you will also get above 70% accuracy.
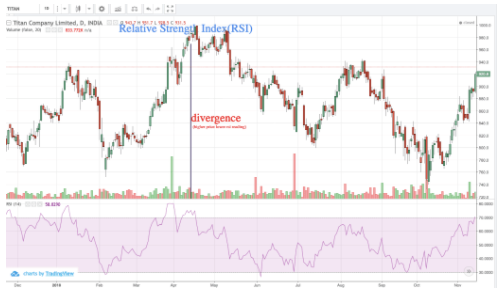
Even after using this method, people face losses. So it is better to combine RSI with the price option. For more accuracy, you can combine RSI with Price action.
Candles show the stock prices, while below the pink line shows the RSI indicator. It is around 70, and the bar is in 30 regions.
And the RSI line goes up and down in the same range (30 -70). Here RSI touches 30 and then gets bounced. Here RSI gives us profit, and the price goes up. So you can buy it here.
Year Wise Stock Market Predictions
Although it is complicated to predict the stock market and stock movements. Still, there are many methods and indicators that investors and analysts can use to predict stock movements and stock values.
Here, we have made this task easy for you. We have mentioned all year wise stock market predictions.
Stock Market Predictions 2021
In 2021, you will come across a market indicator that is widely used by investors. Its name is Warren Buffett Market Indicator.
The benefit of this method is that it compares the total value of the stock market to quarterly gross domestic product (GDP) number. It records and signals that the stock is overvalued and riskier than ever.
Stock Market Predictions For Next 5 Years
India has positioned itself as the world’s 7th largest stock market. The future of the stock market is bright for the next 5 Years.
The most remarkable economic analyst predicts it and stock investors that we will achieve in the next 5 years that is equal to what we achieved in the last 15 to 20 years and also Nifty mayor will get doubled or approach 20,000.
There are many reasons for this happening. The government has taken many steps such as GST, transparency created because of Demonetisation, Infrastructure development, and reasonable housing.
Moreover, investors will get benefited from Equities with good returns.
Stock Market Predictions For Next 10 Years
In the next 10 years, some sectors will help you earn money in the stock market. They include medical and healthcare, technology, industrials, real estate, and energy stocks. You can invest in these sectors through shares, mutual funds, and ETFs.
ETFs consist of all types of stocks, commodities, and bonds. Besides, Gold stocks and 5G stocks (5G phones) are also attractive.
Stock Market Prediction Game
Stock Market is a game in itself. There are some games designed for you which help you to trade in the stock market virtually. Some are mentioned below.
- Money Bhai
- MarketWatch
- DSIJ Stock Market Challenge
- ChartMantra
- TrankInvest
In a way, they are like replicas, which let us learn which strategies will work or not. It also shows the different forms of making profits. Here you are given a particular amount of virtual money to trade.
Stock Market Game provides you with a practice ground to understand the brokerage and other charges.
You will get benefits and spend carefully when you put your money in the stock market. Market trends, price movements, track investments, and technical analysis are important terms that you can understand and play this game.
Conclusion
Stock Market Prediction is the most effective way to determine the stock market’s future value and future stock movements of a financial exchange.
The more accurate you predict the prices, the more you will get returns and earn profits since it is true that precise and detailed information of stock you wish to trade.
Knowing about the factors such as interest rates, politics, and economic growth in advance helps a lot in stock trading. These are factors that influence the volatility and liquidity of the stock.
Apart from this, many tools and techniques have been launched into the stock market, and you can also use them to make a profitable trade in the future.
Wish to start trading in the Stock Market? Refer to the form below
Know more about Share Market