


Looking for Low Brokerage, High Margin & Free Tips?
Positional Trading Strategies
| | Trading | No Comments
No matter what type of trader you are, the ultimate goal is to earn greater profits, right! Especially if you’re a positional trader, you have the liberty to go for either short term or long term based on various positional trading strategies you choose.
Wait, are you new at trading positions and not sure about what these strategies are? Worry not, here in this article you’re going to learn about these, so stay till the end.
First, let us understand the concept of positional trading in brief.
Some confuse position trading with swing trading. The major difference is the time frame. Basically, positional trading is known as the extended form of intraday trading.
Here traders invest in trends that have the potential to give greater profits in the mid to long term that can be weeks, months, or even years.
Positional traders are trend followers. They pick stocks based on trends after thoroughly analyzing them fundamentally and technically. And they know that not only can they earn profits from bullish trends but also from bearish trends.
The question arises when do these professionals enter and make an open position in the market and further when they go short, how do they know the right time frame?
Well, this is when the position trading strategies come into play.
4 Powerful Positional Trading Strategies
We’ll look into the most popular positional trading strategies that will help you as an investor to get handsome profits, such as:
- Support and Resistance Strategy
- Breakout Trading Strategy
- EMA Crossover Strategy
- Pullback and Retracement Strategy
Let us go through each of these ones by one for better understanding.
Support and Resistance Strategy
Before you try to understand how this strategy works it is highly prominent to know what “Support and Resistance” are!
Now every stock has its own defined range between which its stock price moves. The lowest point of the range is called support while the highest price point of the defined range is called resistance level.
Support Strategy
In literal terms, support means to “keep up”, here in the stock market this is known as the indicator that prevents the price from falling any further or the lowest price point where a bullish trend can commence.
Here you can find buyers entering at the low price with the hope to sell at a considerably higher price point, obviously to get greater returns.
There is a high potential of price bouncing back once demand increases meaning buying pressure heightens once the stock price touches the support line. Please note that the support level is always lower than the current market price.
Support behaves as a set-off to buying shares and it is seen as one of the very crucial Positional Trading Strategies when you want to keep an eye at the bottom prices a stock may potentially reach.
Resistance Strategy
From the word itself we can understand, Resistance is something that stops the stock price from rising. Basically, the maximum limit up to which the price can rise. Further, there is a high possibility that the stock will dip to commence a bearish trend.
It is exactly opposite to “support”, as this indicator forms a supply pressure meaning you’ll be able to see more sellers at this point in the market. Since every position trader or investor follows the trend with the basic concept in mind- “Buy low and sell high”.
This is where investors plan their exit from the market-leading to a price drop in the stock. An important point here to remember is that the Resistance level is always higher than the current market price. So it triggers the sale of shares.
Now comes the question, how do we differentiate these Support and Resistance levels in the chart?
The answer is simple, if the CMP (current market price) is below the identified point, it will be resistance and vice versa.
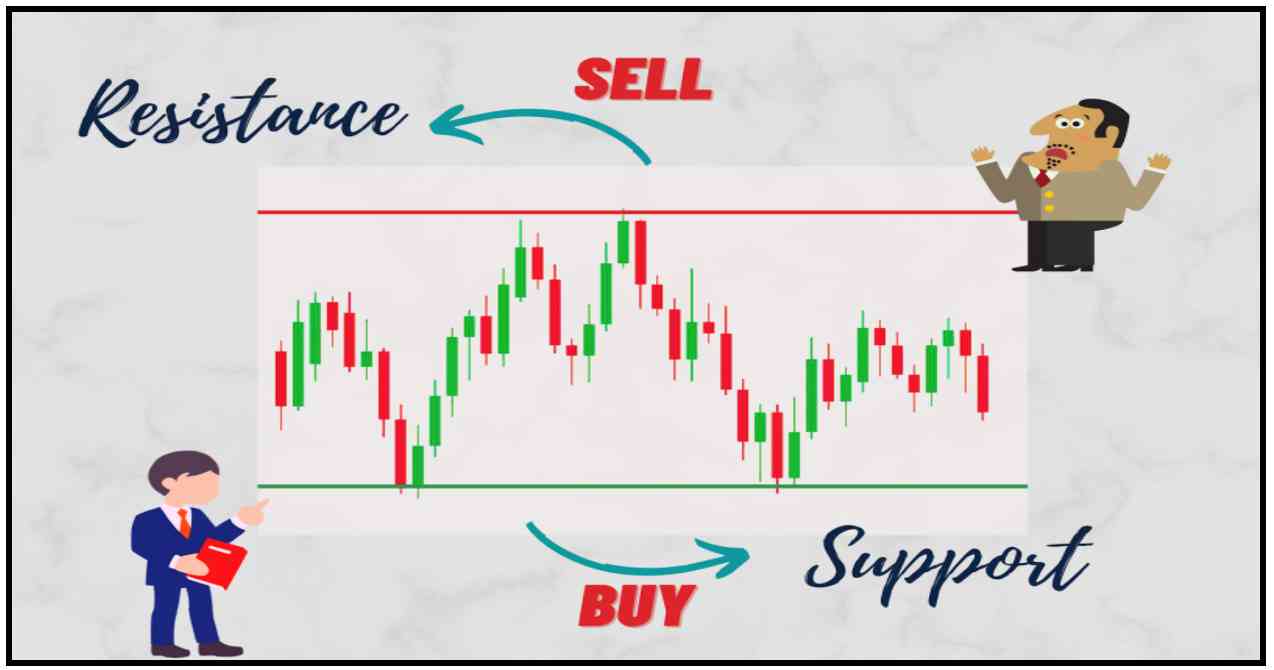
The same statement is explained in the picture below. The red line indicates the resistance level which is above CMP while the green line represents the support level, below the current market price where you can plan to open a position by entering the market.
Since positional trading is the game of trends, these S & R are merely used as the indicators like any other technical tools showing a possible rise or dip in the trend so that the investors can plan their entry and exit accordingly to avoid any unnecessary risks.
It can also be said that these price points help in identifying the targets for trade, indeed useful for anyone in long-term trade such as positional trading.
Hey, do you love games? Pretty sure you do. How about “Brick Breaker”? This record-breaking favourite of many has been played ever since. Let’s try to understand the concept of Support and resistance through this game.
Let’s say, the bricks are the resistance and it acts as a barrier that does not let the ball (representing price) go any further in an upward direction.
While the slide on the lower side is the support that does not let the ball drop. Isn’t that interesting. You can analyze the price range prior to the actual rise or dip.
Hope this strategy is clear to you, now we can move ahead with yet another popular strategy called, Breakout trading strategy.
Breakout Trading Strategy
It is beneficial to identify the support and resistance levels to understand this “Breakout Trading Strategy” (this is one of the most wonderful mixes of Positional Trading Strategies).
Now as defined above, the stock price trend between the specific price range is called support and resistance. But every time the stock moves it keeps on creating new support and resistance.
This means that the stock price breaks its earlier price range and moves beyond or below. This specific phase is called a breakout.
The breakouts thus come with the opportunity for the traders to make their way in the trading.
So, whenever the stock price breaks its previous support level, there is a higher chance that the price will now fall drastically thus opening the gateway to go short.
On the other hand, the stock price breaking its resistance level will tend to rise in price and hence creating the opportunity to go long.
The positional trader in this strategy usually tries to open the position at the beginning of the trend with the belief that breakout points form the foundation of large-scale price movement or a long trend as we may say.
If you know how to identify the S & R levels then going with Breakout Trading Strategy is a piece of cake and thus you can excel and make your accounts heavy. While if you rush and make a slightly wrong decision you may lose a lump sum amount all at once.
“Trading in the market is subject to market risks”– as you must’ve heard many people saying this, with no doubt the statement stands true while dealing in financial markets.
Hence before blindly choosing the strategy, analyze your trading needs and financial goals so you can make the appropriate decisions and have a smooth trading journey ahead.
Moving further, we have our third most popular strategy,
EMA Crossover Strategy
If you’re already an investor, you must be well aware of the famous trading indicator namely, Exponential Moving Average.
First, we’ll try to understand how this strategy works.
Well, known as an ideal moving average, traders look for moments when these EMA lines cross each other.
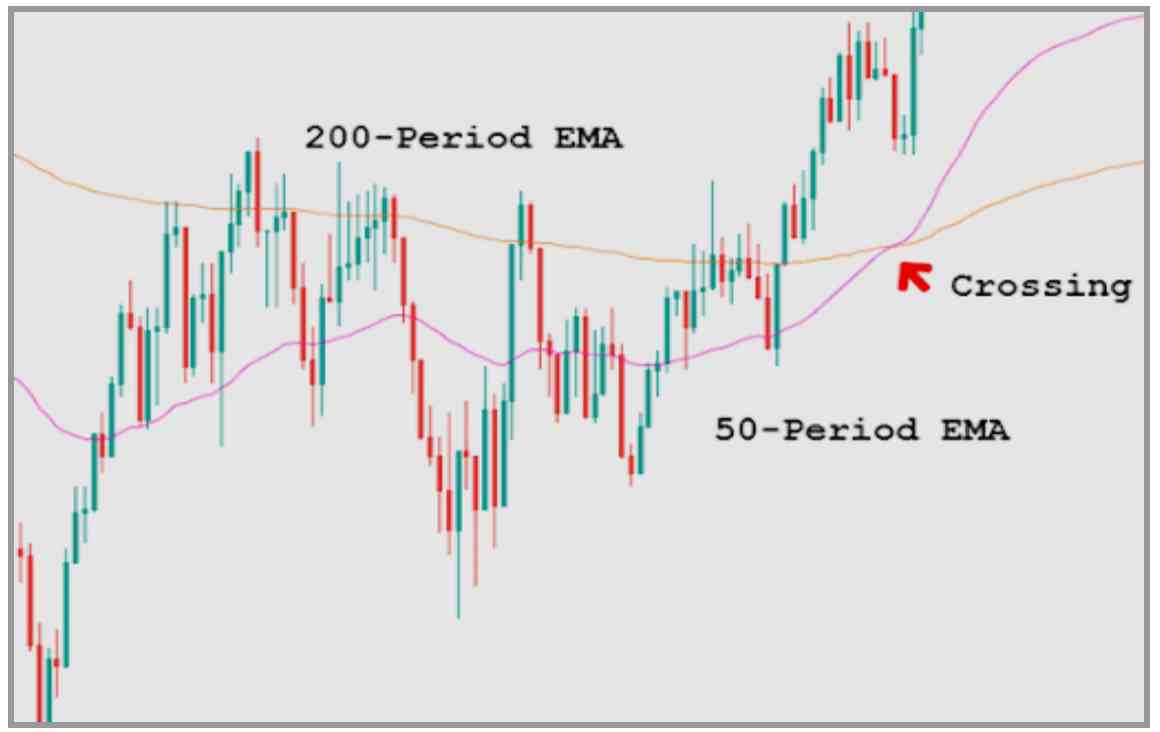
In general, for better analysis and results, the position trader generally relies on the 50 days and 200 days of EMA.
The crossover of these two EMA generally gives traders the right and strong signal of the upcoming trend.
As when fast moving average intersects slow MA from below, the point of intersection is known to be the “Golden Cross” which indicates a possible bullish trend in the future.
Now opposite to this is the “Death Cross” which happens when the fast MA line crosses the slow MA line from above and as a result indicates a further bearish trend.
Although these help the investors to understand points where they can go long or short but by the time this happens, the price fluctuation happens and yet another cross point is detected.
Thus to avoid this hardship for investors, another method is to use the RSI indicator with these EMA.
It’s interesting to know that these indicators predict the golden cross even before it happens to give you time to make a decision by correcting the crossover flaws.
It is said that when the stochastic RSI level crosses 20-level, you’ll probably see a bullish trend. But first, you need to also analyze the 200 days MA value. Any price value above this point is known to be the most recommended to act upon.
Similarly, for short-term or day trading, it is good to follow the best EMA for intraday where you can follow the same strategy with the shorter time frame of 5,8 or 20 periods.
Pullback Strategy
The movie “Cars” of 2006 has taken its place in people’s hearts. That tempted people to have a toy car collection at home.
Remember? we as a kid played with those pullback cars, the one you pull back slightly tends to move faster in the forward direction. Honestly, the red car is still our favourite right?
In a similar context, we can relate our next positional trading strategy, which is Pullback and Retracement. Let us look at the terms for more clarity.
Talking about the literal meaning of pullback, this means “the drop in price or demand”. The pullback can be referred to as the short-term movement of price in the opposite direction of the underlying long-term trend.
The motive is to buy when pullback occurs and sell it at a higher price before another pullback happens. This offers an opportunity to join a trend at a slightly lower prior advantageous price.
After you have understood pullback, it becomes quite simple to know about retracement, as the two terms are sometimes used interchangeably.
Retracement is known as a temporary reversal of a long-term trend, however, when this is over, the price follows the previous trend. Very similar to pullback.
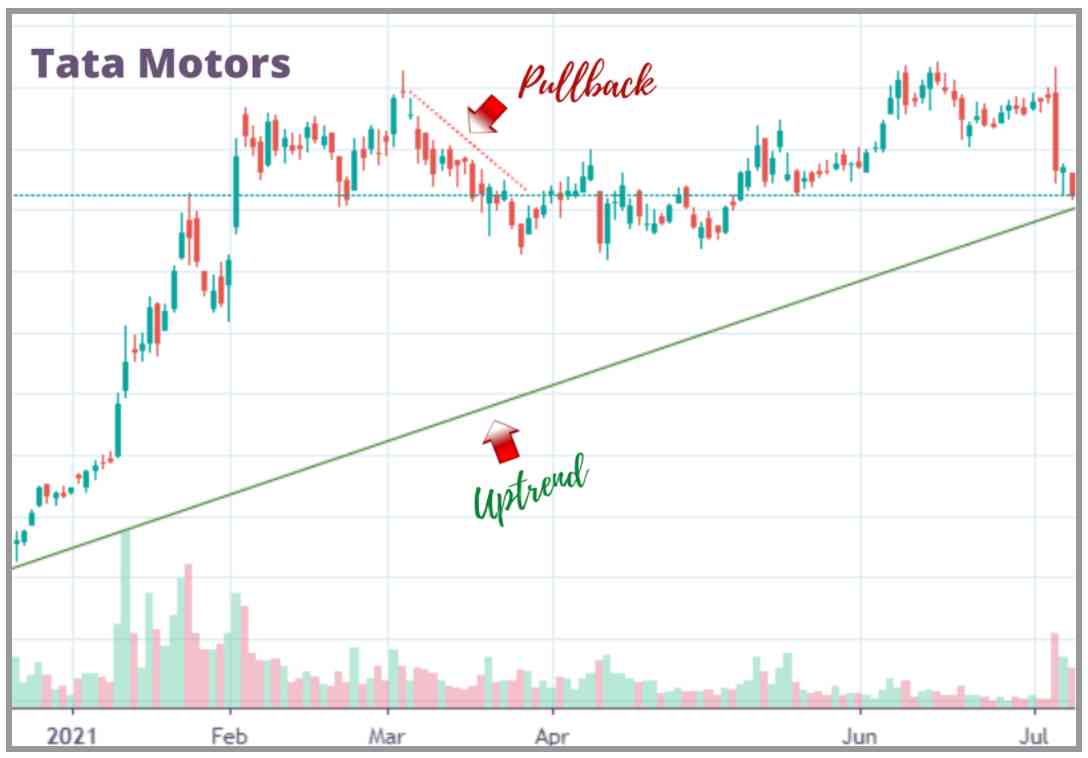
We can take the example of the stock, Tata Motors from the image shown above, here the long-term trend is bullish as we can see, however, many short-term pullbacks or retracements can be noticed in a single trend.
These are the possible opportunities the investors get to open a position at a beneficial price thus enhancing the possibilities of earning more profits lowering the risk of a fiasco!
These dips act as pauses in which traders are tempted to capitalize, boosting the profit amounts. Also for this strategy, professionals use indicators such as Fibonacci retracement to identify the entry and exit points more accurately.
They draw the Fibonacci retracement lines at 61.8, 38.2, and 23.6 per cent on the price chart to go long and short accordingly.
Conclusion
Now that you’ve understood various positional trading strategies which you can use to boost your profit-earning potentials. But one should always be aware of the risks involved here.
Although the risk factor is reduced in positional trading as compared to intraday or swing.
However, as huge capital is involved for a longer duration, there are chances if you don’t follow the rules that include proper fundamental analysis with Positional Trading Strategies, you might face huge losses.
Yet not to forget the benefits such as low maintenance and riddance from short-term price fluctuations, hence no unnecessary capital risk.
Till then happy investing!
Nonetheless, if you are looking to learn positional trading strategies or need any help in stock market investments, let us know your details and we will call you back for further help: