


Looking for Low Brokerage, High Margin & Free Tips?
Positional Trading
| | Trading | No Comments
Now that you’re here, we can assume either you are trying to explore new ways of trading or are about to start trading in the stock market. It is good to gather complete knowledge of this trading world as we all know “half-knowledge is dangerous”. So today we’ll talk about Positional Trading.
Many traders enter the stock market with the intention to earn profit but are not aware of different trading options. Few end up doing the intraday, while some go for the swing trading. Right?
But how many among you know or do positional trading.
Maybe many are already into it but are not completely aware of its meaning and strategies.
So, let’s discuss complete information on what is positional trading and how to do it using a trading platform?
What is Positional Trading?
Positional trading or position trade is a mid to long-term type of trading that is done based on either speculations or the fundamental analysis of the stock. Any investor or trader holds the position for weeks or months or maybe years.
Yes! It sounds like swing trading but it is not. For your understanding, in simpler terms, we can say that the key difference between swing trading and positional trading is the time frame involved between buying and selling of assets or shares.
In swing trading, the investor buys and sells stocks within a matter of days but that’s not the case in positional trading, here the investor holds his shares for longer durations until he reaps the best benefits out of the trade.
Usually, position traders aren’t much concerned with the short-term fluctuations in the stock prices, they focus more upon the initial price trend of the stock or any other segment- commodity or futures and options (or even Commodity Futures trading as well), currencies, etc.
Professionals play very smartly as they rely on both fundamental and technical analysis of a stock while making trade decisions by referring to weekly, monthly, or yearly charts while evaluating any position.
Anyway, the objective of every type of trader is to generate more and more profits.
Still not clear, let get its better understanding with an example.
If you’re an animation lover, you must have heard about “The Bee Movie”, the bee soldiers were responsible for collecting nectar and spreading pollen seeds in the fields to get more of it in the future for making delicious honey.
You may understand position trading in a similar way, the position trader invests money (pollen seeds) to get returns in the future (flowers for nectar).
They set a goal, impose a stop loss, further when the market is bullish and a new higher price is reported, these traders revise stop loss to minimize risk and keep doing so until any indication of the bearish trend is observed. This may keep happening for weeks or several months.
Okay, this is silly but we have talked about positioning and position trading. Let’s now try to understand the basics, what is “Position” in the stock market?
What is Position in the Stock Market?
In the stock market “Position” is the kind of ownership that you attain overstocks, securities, or assets either by buying or selling.
A trader takes a position when he buys stocks in bullish intent or sells short indicating bearish intent, either way gaining profits.
This brings us to our next part: long position and Short position in the stock market!
Long position in Stock market
Usually, a long position in the stock market refers to :
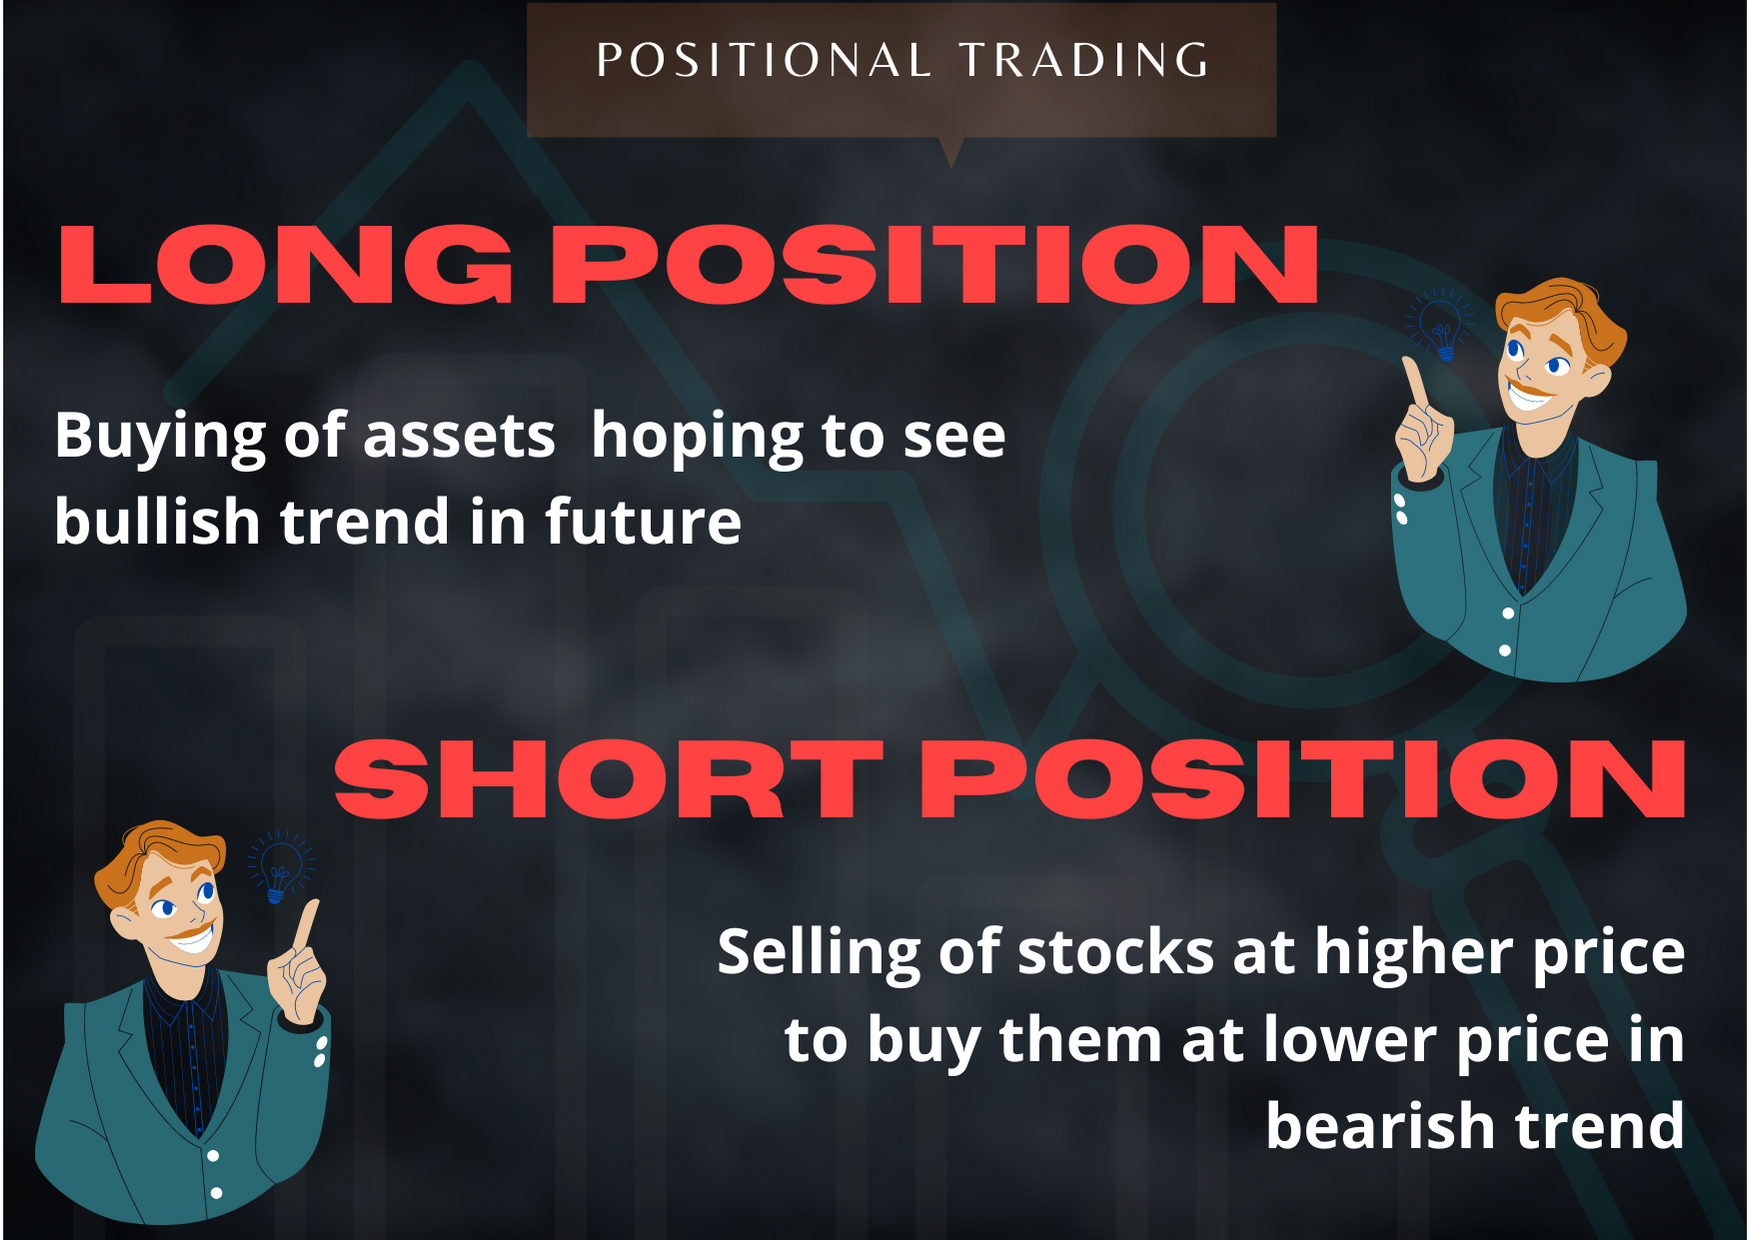
“Procuring shares or stocks with the expectation that it will see a bullish trend in future. It shows what the trader has purchased and how much ownership does he attain in the market”
If an investor desires to avail benefits from the upward trend of the price of stocks, he will “go long” in respective stock, well long in the stock market can have different meanings based on the context it is used in.
In simple terms, going long in the stock market simply means holding a buying position.
The holding period again depends upon the type of trading you opt for. So for intraday traders, this is generally 1 day, for delivery traders it could be more than 1 year to 5 or 10 years.
While for the positional traders it varies from few months to years or simply till the time they make a profit from their position.
The opposite of this is the “Short Position”.
Short Position in Stock Market
Not just by buying can an investor gain profits, in case you don’t know, selling before buying can also give you huge profits.
This is called “short selling” or simply a short position in the stock market. When the investor notices a bearish trend they see an opportunity to place a sell order at a higher price and then buy the same at a lower price, the difference will be the gain.
We can see this through an example for better understanding:
Suppose Honey Singh, who is a trader, saw a bearish trend in the stock Cipla. He thought of making some profits so he decided to go short. He sold about 100 shares worth ₹10000, with ₹100 being the price of each share.
The price of the share dropped to ₹80 so he again bought the same number of shares worth ₹8000.
In the end, he made a profit of ₹2000.
That’s the fun part of the share market investing. There are answers to questions as basic as Can I Invest 1000 Rs in Share Market too.
The thing to consider while shorting is to maintain a minimum balance or margin in your trading account. Again this varies from stock to stock and the CMP of the share.
Isn’t that amazing! Also, you must know that to go short on a position, you needn’t always have shares in your account for short selling, you can borrow shares from the stockbroker and when you buy at lower prices they are returned to the broker. Easy right!
What is Open Position in Stock Market?
Holding the buying or selling position simply means an open position in the share market. To make the concept clear let’s take an example.
Let’s say, Jazz owns a bungalow in Chandigarh and is currently living in it with his family. He got a work opportunity from Scotland. He accepted the offer and is moving abroad. Hence he decided to put the house for sale, posted about the same on housing.com.
Every now and then he gets calls from potential buyers, but then they offer a lesser amount than he initially bought the house for. Finally, after about 2 months, he gets his buyer who pays a huge amount for the house, as he desired.
He happily moved at a good price.
So, this situation can be related to position trading as well. Posting an ad to sell the house is like the open position where is looking for the gains and later on selling
When an investor attains ownership of shares by going long he opens the position which will not be closed until he sells them off.
A simple example can be, you buying about 300 shares, opening a position. And then closing it when you sell it in one go or in fragments.
Guess you got a clear idea of positioning here, let’s further learn how to do it! This is exciting, after all, who wouldn’t want tips to earn more in the share market!
How To Do Positional Trading?
Learning positional trading is quite easy as compared to other trading types like swing and intraday.
If you’re a full-time employee, then obviously it’s impossible to monitor the market and stock trends round the clock.
But, positional trading gives you the liberty to trade free, meaning you look for long-term trends and so about 30 minutes per day works just fine.
Just a simple method will let you gain good profits in positional trading :
To learn positional trading, first track your personal biggest trends, since it’s a long-term holding thing, you would need to monitor bigger trends for longer time frames, say, weeks, months, or even years.
Your second step would be to specialize in one market. Since the stock market is a vast space of segments to trade in, you would need to gather enough knowledge to understand your area of comfort or say your segment of interest is it stocks or ETFs or anything else.
Do not get overwhelmed trying to learn everything at once. Simply take one at a time, this will give you enough time to understand your favorite one and thus generate more profits in your pockets.
The final step is to set a trailing stop loss to lock in profits as it has proved to be among the most efficient ways to minimize the risks of loss while you ride a trend.
This is the general way to trade positions but what if you get to know some strategies too? Let’s get into it and explore the treasure of profits in position.
How to Find Stocks for Positional Trading?
Usually, position traders base their stock picking on the market trends. They tend to believe that if a trend is initiated, it will continue and hopefully appreciate with time.
They plan their entry and exit with regard to stop loss or trailing stop loss. It is worth noticing that for position trading it becomes quite essential to stay in the market till you see price volatility meaning till the price is moving in trend.
And clearly, they go for technical and fundamental analysis of their stock to get greater returns in the long term as per their goals.
When fundamental analysis on one hand relates to the stock-picking that has the potential to give good earnings, technical analysis helps the position trader to analyze for how long the stock will sustain in a bullish or bearish trend.
While picking stock in positional trading, small price changes are ignored, trend momentum is considered instead. If you’re planning to do positional trading you can keep an eye on top gainers and top losers for sustainable trends to go long or short accordingly.
Positional Trading Strategies
Before you actually get into strategies, it is important to understand which strategy works best for you as per your trading needs, this can be done based on certain parameters such as:
- How much are you planning to trade with or invest?
- How much time can you spare for monitoring the market every day?
- What are your financial goals?
- Finally, your risk appetite
And obviously, you are here to know about profit-generating strategies but one thing you must always know is that with investment comes the risk of losses, sometimes steep while sometimes minor.
So it is crucial to always have a complete understanding of the segment at least that you are trading in. Here we present a few popular strategies that might just work for you:
Support and Resistance
Well, this is known to be the most common strategy that lets the investor get the benefit of Buy Low and Sell High.
Support and Resistance indicate the range of price movement of an asset. To understand in simpler terms, Support is the area of your chart that shows potential buying pressure, usually when a lower price is indicated.
While in the case of Resistance, you see potential selling pressure when a slight or steep bullish price is observed.
Now actually, the best time to go long is when the market is ranging at support, and when the market is ranging at resistance, it shows a good time to go short to get a greater profit margin.
Moving to next,
Breakout Trading Strategy
Before trying to know about this strategy, you must first look at the definition of “Breakout”.
Generally, every stock price shows a specific pattern and moves within a specific price range called support and resistance level.
But there is a time in the market when certain stocks break their price range and move beyond their specified level.
This point is called the breakout point.
Thus, a breakout point is the price of the stock that moves out of trend or support and resistance range as we can say, forming a starting point of probably a major market trend.
And so you can see how important this strategy is. Well in this all you need to do is observe the breakout points and accordingly go short or long observing the perfect opportunity in the support and resistance range.
When the resistance line is crossed, the trader enters a long position and enters a short position when the support line is crossed. So you’ll need to look for historical support and resistance ranges of the asset price in trend over the weeks or months.
Hence historical data proves to be of huge help in identifying range and breakout points.
EMA Crossover Strategy
Often preferred by professionals, 50 and 200 days EMA is considered as the ideal number in terms of moving average.
As you must be wondering about what opportunities are we talking about.
When the fast MA line crosses the slow MA line from below, then the point of intersection is called the golden cross, indicating a bullish trend and thus the perfect time to go long.
When the crossover happens from above then the point is called the death cross. But by the time traders try to notice the lines, the trend changes and the new fluctuation happens thus to correctly lock in profits it is better to use more indicators such as RSI, etc.
These indicators will help you in identifying the beginning of bullish trends so you’ll have time to place an order if you wish to.
Thus if this strategy suits your financial goals provided you have a better understanding of identifying the golden and death crosses, you needn’t have any second thoughts.
Now we are onto our next positional trading strategy- The Pullback and Retracement strategy.
Pullback
This strategy is for traders who look for opportunities to enter the market. This simple strategy leads to the buy low and sells the high concept. Pullbacks are the moments of reconciliation when the market is experiencing a bullish trend.
Now during pullback to eliminate the chances of any dip in trend, traders use Fibonacci retracement that helps them to identify the perfect time to enter the market and exit from it.
These lines also tell them the range that they further use to identify the best trading opportunities.
Lastly, let’s talk about the range Trading Strategy.
Positional Trading Indicators
While we’re talking about strategies, it becomes important to know about the indicators that the positional trader uses.
- Fibonacci Retracement
- Stochastic RSI
Range
As we have already talked about Support and resistance, Range is nothing but the combination of both.
When you apply range in the pivot chart, you get to see the highest price at which the stock price has reached along with the lowest price which as you know is nothing but support indicating the buy signal.
While you get the selling signal at resistance. So this entire stretch indicates the probable future trend so the positional trader can accordingly take decisions and book profits.
Fibonacci Retracement
Fibonacci is known to be the natural indicator for it is said that the golden ratios of this series exists in nature everywhere, be it the number of petal in a flower,
In the Fibonacci series, any number is simply the sum of the previous two numbers. And through which the Golden ratios are calculated. These ratios are 61.8%, 38.2% and 23.6%.
Wherever there is pretty decent fluctuation in the chart, you can use these golden ratios to enter the trend by opening a position in the trend.
Lastly, we have Stochastic RSI.
Stochastic RSI
So the popular RSI indicator is generally used to identify the overly bought or overly sold stock.
In positional trading, the ideal range is 40 to 90 which 60 is considered the actionable mark. When the RSI crosses 60, it depicts the buying signal and when it dips below, you get a selling signal.
Coming to stochastic RSI, it is nothing but the combination of both RSI and stochastic oscillator; that swings between 0 and 1.
Readings below 0.2 are considered the oversold situation while the reading above 0.8 is the overbought situation. Oversold situations hint on bullish trends and vice versa.
After understanding the techniques and tips to enter and exit from the trend, let’s now look at the best time to do positional trading.
Positional Trading Time Frame
In general, positional traders hold their positions for longer durations.
Yet we know the active market hours which are from 09:15 am to 3:30 pm. You can place orders anytime in between, not to forget you can also choose to place AMO in case you feel a stock is worth trying.
Generally, a position trader looks for strong trends only then using strategies and indicators they decide to invest. Of course, this also depends on the investor’s personal trading needs and financial goals.
Here investors not only depend on bullish trends but also look at the potential of earning great profits from a downtrend also which is called Short selling.
Positional Trading Books
To help beginners, we have a list of books that any interested positional trader can go for to understand positional trading in a much better way.
| Name of the Book | Ratings |
| Trend Following – Michael W. Covel | |
| Trade your way to financial freedom – Van K. Tharp | |
| Secrets of profiting in Bull and Bear Markets – Stan Weinstein |
Conclusion
Now that we have come to the end of this article we hope you’re now clear with the concept of positional trading. However, Not everything that glitters is Gold, so prior to making any decision you must understand the pros and cons of this type of trading.
Pros
- First is obviously the less maintenance.
- Safe from short-term price fluctuations.
- Freedom to use multiple trading styles simultaneously based on trends.
- Offers a longer time frame.
- Lower risk as compared to swing or intraday trading.
Cons
- Low liquidity
- Requires high capital to keep open positions for a longer time frame.
- With the potential to get greater profits comes chances of attaining huge losses in one go as higher capital is invested.
Finally, it is up to the individual trader or investor whether position trading satisfies their trading needs or not. With lower risk, this might be a great option but also the burden with hefty capital requirements comes along.
Till then happy investing!
Want to trade, start now. Open a Demat account for FREE!