


Looking for Low Brokerage, High Margin & Free Tips?
Three Black Crows
| | Chart Patterns | No Comments
More Chart Patterns
Three Black Crows is a pattern used in technical analysis of stocks, currencies, indices etc. to predict the reversal of the uptrend. It happens when bearish forces become greater than the bullish forces on three consecutive days i.e. 3 consecutive trading sessions.
After this bearish pattern is identified in technical charts, an opportunity to take a short position arises in order to gain an advantage of reversal of the uptrend.
Have you observed such a trend before to take an objective position and make a certain profit out of it?
Don’t worry if you have not. Post this read, you will be in a far better position in the future to ripe quick profits off the market when such situations arise.
Three Black Crows Pattern Technical Analysis
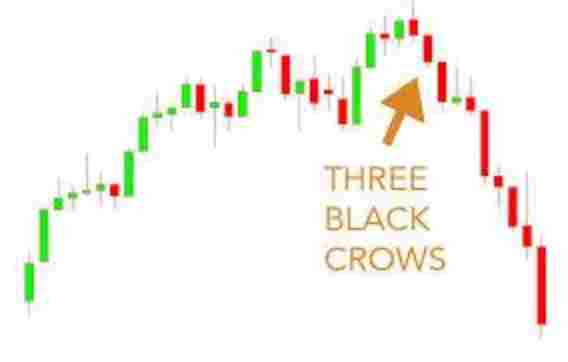
Three black crows are a visual pattern and no calculations need to be done in order to detect it. There are three consecutive red candles with long bodies on three trading days.
Candlestick charts show open, low, close and high prices of a trading day.
The candles in three black crows should have long bodies with short or non-existent upper and lower shadows. This implies that the price of the security has remained within the low and high range of the day.
The best way to understand this concept is to go through some of the crucial situations and corresponding market conditions.
Let’s do that!
Three Black Crows Pattern In Downtrend
Each candle needs to open a little above the closing price of the previous day. After the opening, the price of the stock should be pushed lower throughout the trading session.
The closing of the day should be near the low price of the security during the day.
This pressure in the downward direction indicates the beginning of the bearish trend. Generally, it can be said that the three black crows pattern develops a “resistance” zone. One should also pay attention to the location of the pattern in the chart.
If the trend line is broken by the first candle, the decline in price can be very steep. This happens mostly when there is no support zone near the stock price. It looks like the picture posted below:
Three Black Crows Pattern Trading
Let’s understand how to go through your trading when working with a three black crows pattern.
We will take it step-by-step:
Step 1:
The first candle is seen in an ongoing uptrend. It should be “red” in colour which means that the close price is lower than the open price of the security. It can be a small or long bearish candle.
Step 2:
The second candle should also be red in colour and can either be a long or small candlestick.
It’s opening price should lie within the body of the previous red candle. The opening price of the second-day candle should preferably be between the middle point and closing price of the previous day’s candle.
This means a gap up opening. The closing price must be below the close price of the previous day’s candle.
Also, the second-day candle should not break the high price of the first day’s candle.
Step 3:
The third candle should again be red in colour and can either be a long or small candlestick. It’s opening price should be within the body of the previous day’s candle.
The opening price of the third-day candle should preferably be between the middle point and closing price of the second day’s candle. This also means a gap up opening.
The closing price should again be below the close price of the second day’s candle.
Also, the third-day candle should never break the high price of the second day’s candle.
Note – In a three black crows candlestick pattern, the first candle or the second candle or the third candle or any two of them or all of them can be bearish marubozu candles. A bearish marubozu candle means that the opening price of the stock is the high price of the day and the closing price is the low price of the day.
There is only the body of the candlestick.
There are no upper and lower shadows in the candlestick. There can be 8 possible combinations of candles in this pattern.
The pattern is cancelled if the close price of the second or third candle is more than the opening price of the first candle. This pattern works very well of the lower shadows of the candlesticks are very small or absent altogether (which means equal closing price and low price of a trading session).
Three Black Crows Pattern Usage
In order to use Three Black Crows Candlestick Pattern for trading purposes, one should also pay attention to other factors like volume of trades, Relative Strength Index (RSI), etc.
The volume traded in the third-day candle of this pattern should be more than the volume traded in the first-day candle. The volume traded on the second day does not matter much.
Although if the volume traded on the second day is more than the volume traded on the first day, it is an added advantage for us. In simple words, the volumes of the candles in three black crows pattern should be in increasing order.
Basically, it should look like the picture posted below:
Three Black Crows Pattern Example
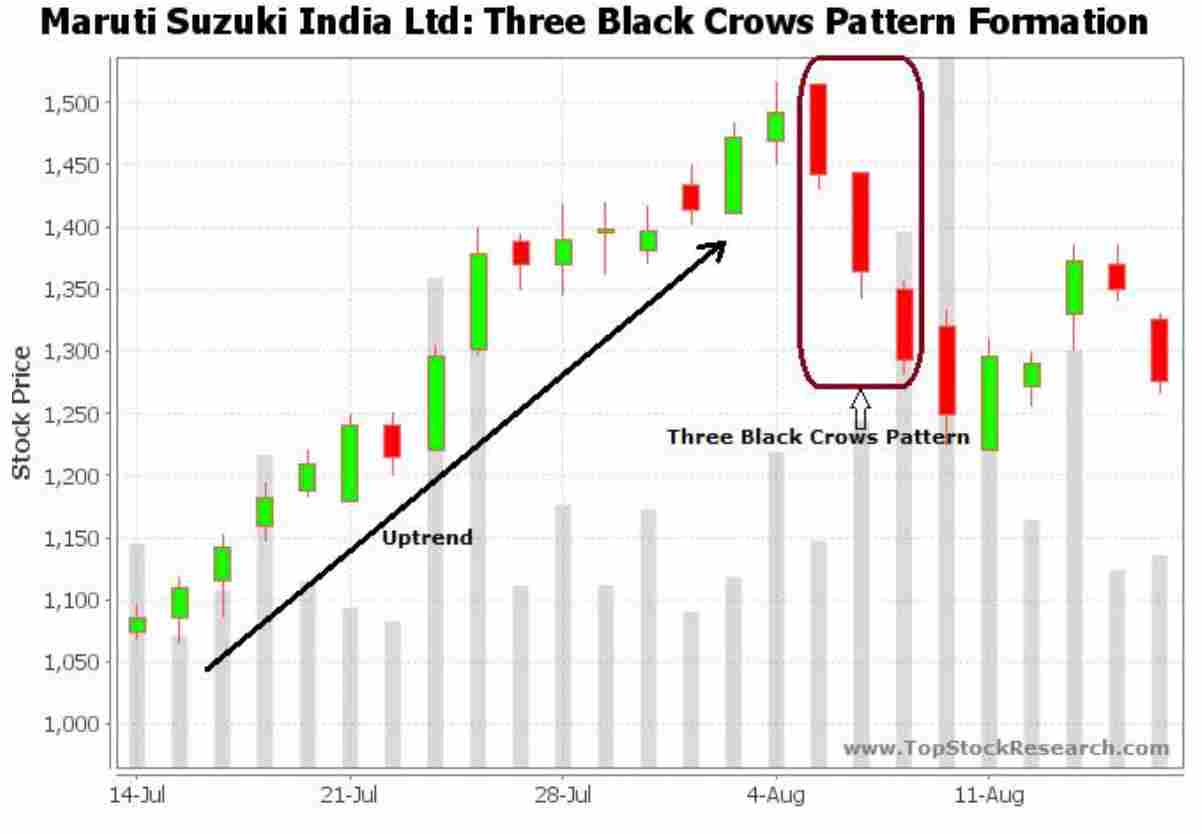
Let us look at a real-life example of three black crows candlestick pattern. It is clearly evident in the technical chart of the stock of Maruti Suzuki India Limited.
A long uptrend can be seen on the chart and three consecutive red candles can be seen almost at the top of the chart. These three candles fulfil the necessary conditions of the three black crows pattern.
And quite evidently, this is followed by the downward movement of the stock price in the next few days.
Three Black Crows Pattern Strategy
This pattern in technical analysis can be used by traders to gain good profits. Three black crows pattern works very well on monthly, weekly, daily and intraday charts.
It can often be spotted on the daily and intraday charts.
When three black crows pattern has been identified on a technical chart and the next candle shows a gap down opening i.e. the opening price is lower than the closing price of the previous day, one should initiate a short position in the stock or index.
This is a kind of confirmation of trend reversal. After this pattern, the bearish forces start overpowering the bullish forces.
In intraday trading, one can look at 5 minutes, 15 minutes and hourly charts to identify this pattern.
If a trader is into positional trading, then, he / she must look into the daily and weekly technical charts to trade according to this pattern.
Three Black Crows Pattern Timing
After the three candles of the pattern have been formed and the next candle shows a gap down opening and the closing price of the candle is lower than the low of the previous candle, a trade should be initiated in the short side.
Stop-loss should be fixed at the high price of the third candle formed in the pattern.
If the next candle formed after the three black crows pattern does not close below the low price of the third candle of the pattern, a trade should not be initiated.
One should take a short position only after the confirmation of the beginning of the downtrend which comes after the closing price of the new candle happening lower than the low price of the last candle of the pattern.
The stop loss should be the high price of the first candle of the three black crows candlestick pattern.
After initiating a trade on the basis of this pattern, profit booking should not be done unless one can identify a trend reversal sign on the chart.
Three Black Crows Pattern Screener
There are many stock screeners available on the internet which are free as well as paid.
In fact, some of the brokerage platforms also provide the feature of screeners on their user interface.
On these screeners, one can easily fill all the conditions necessary to be fulfilled for a three black crows candlestick pattern and identify it as soon as the screener is run.
Conclusion
Three Black Crows Candlestick Pattern is a trend reversal pattern which is formed to indicate a downtrend in stock prices after a long up move has been witnessed in the stock prices.
This pattern is formed by three normal bearish or bearish marubozu candlesticks when the open of the second candle is between the middle point and low price of the previous one and the close is below the low of the first one.
Similarly, the open price of the third candle is between the middle point and low price of the second one and the close is below the low of the previous one.
This pattern should be seen along with other factors like volume traded and other technical indicators like RSI to give better and more accurate results.
Volumes traded on three consecutive days of three black crows pattern should be in increasing order.
Once a trade is initiated after the detection of three black crows candlestick pattern, profit should be taken only after some signs of trend reversal are identified on the technical charts.
One should take advantage of online automatic screeners in order to know when to initiate a trade and when to take a stop loss.
In case you are looking to get started with stock market trading and investments, let us assist you in taking the next steps ahead.
Just fill in a few basic details to get started:
Summary
Reviewer
A Digital Blogger
Date
Broker Name
Three Black Crows
Overall Rating
