


Looking for Low Brokerage, High Margin & Free Tips?
Flag Pattern
| | Chart Patterns | No Comments
More Chart Patterns
A Flag pattern is a kind of pattern in technical analysis which shows candlestick trends contained in a small parallelogram or in the form of a rectangle. A minor profit in a downtrend or uptrend is indicated by a flag chart pattern.
Flag Pattern Trading
With a flag pattern, you have two options really depending on the fact that the market is going bullish or bearish.
So, when the market is bullish, the price of the stock is in the upward trend and reach a point of consolidation which generally sets up a support and resistance level, a buy signal gets generated.
When this happens, you can go ahead with your buy order or if you are a little risk-savvy, you may wait for the trend to close to be 100% sure. However, more the wait, less the profit.
But don’t worry about it, you have to trade as per your risk appetite.
This goes on similar lines when it comes to the stock going bearish.
If the price of the stock is in a downward trend and reaches a point of consolidation, a sell signal will be generated. This generally happens when the stock price reaches below the support line.
Now, consider the high point of the flag as your stop-loss price and you may choose to go short on this trend.
With this, we have touched upon the basics of how you may choose to trade on a flag pattern. In the rest of the review, we will go into the details and specifics of how one may carry out the trades while locating a flag pattern on a regular basis.
Flag Pattern Explained
We started in the fourth gear, now let’s chill down a bit and understand what exactly is a flag pattern.
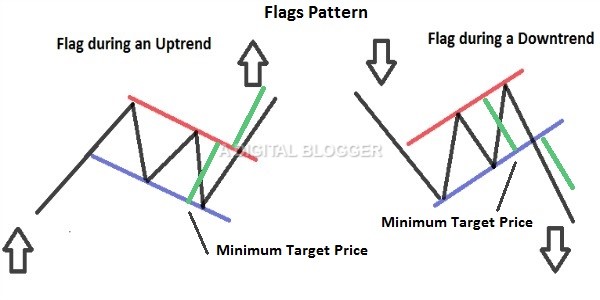
You must have definitely seen a flag of some kind in your life, right? Now, a flag when in its complete motion with the help of wind is, in a way, in a counter direction to the flag-pole (if not opposite).
This is where the term flag pattern has been taken from.
When a stock price is moving in a particular direction, but suddenly, for short duration, an opposite trend (in the counter direction) starts to take shape, it becomes a flag pattern in the trading space.
Having said that, since it is a short duration trend, the earlier pattern is going to come back and with strong momentum and this is where all sorts of buy and sell signals are going to get generated. In other words, these are the profit booking opportunities you need to keep your eyes on.
Because a flag pattern certainly leaves out various such opportunities.
Flag Pattern Formation
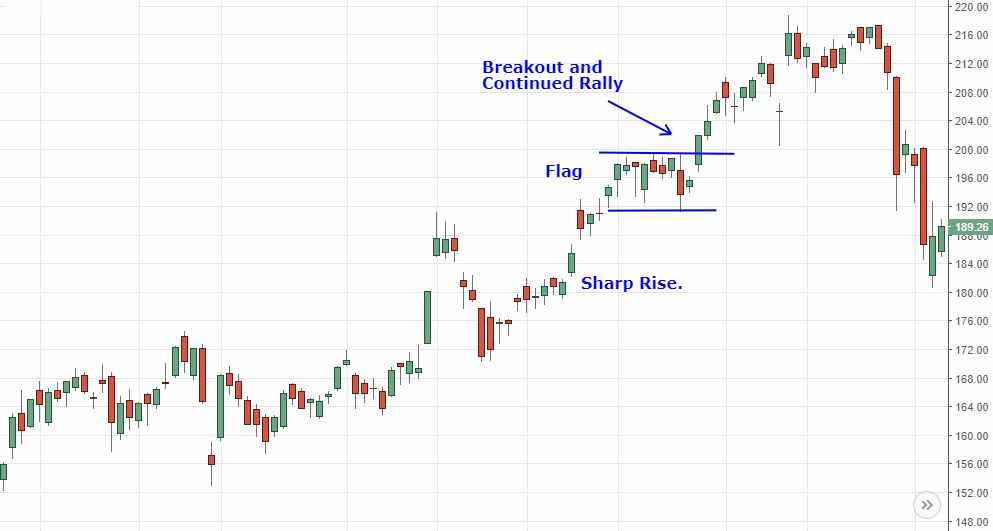
A flat pattern is created when a steep fall or rise is succeeded by a narrow price range during trading. This form of trading is followed by another steep fall or rise. According to technical analysts, a flag is generally preceded and followed by a fall or rise.
Flag patterns are considered to be good chart patterns for trading stocks and possess minimum risk and quick profits. Flag patterns are formed post-market consolidation takes place in a narrow range following a sharp move.
Flags are visible for any time frame of about 5 to 15 price bars.
The “flag” appearance for the pattern is the result of the small rectangle connected to the pole. The pattern itself must traverse between parallel lines and can have a downward, upward, or sideways slant.
The performance of the pattern is considered to be degraded when the angle of the flags is in the same direction as the move which precedes it.
An ideal pattern would be initiated by a sharp higher move, which is followed by a sideways flag. Alternatively, a flag which is angled down to a certain degree is also considered an ideal move. When the sharp move is downward, a flag which is angled higher or sideways can be traded.
One must note that when a move precedes the flag part of the pattern, the move must be vertical, sharp, swifter, and larger than the price move preceding it.
Price movements which are swift and abrupt are indicative of a forceful selling or buying action. Such movements can be utilized to trade a breakout from such a flag formation.
Flag Pattern Technical Analysis
The ideal way to trade with the flag chart pattern is to initiate the trade when a price breaks above or below the lower or upper flag trend line. A stop-loss is indicated outside the flag on the opposite end of the breakout.
When parallel lines of the flag pattern are sloping, the entry point for the breakout is likely to change over time as the line slope occurs over time.
Since the breakout occurs in the same direction as the move preceding it, flag patterns are considered continuation patterns.
To trade using the flag pattern, one must wait for the breakout and anticipate the direction of the breakout to ensure that the right move takes place.
When the breakout is initiated by the trader in a direction similar to the preceding move, the trader can make use of profit target.
There are essentially two different methods which form the basis of the profit target.
The first method is a conservative one and leads to a quick profit. The other method deals with a more aggressive form of a target. This may take a long time but results in a larger profit.
The first target described here is dependent on the distance between parallel lines which creates the flag.
The flag could be about 30 pips wide. In this case, the profit target would be equivalent to adding and subtracting 30 pips from the breakout price, on the basis of whether the breakout price occurred on the upside or downside.
When a strong move takes place, the market is tightly bound and profit targets may be realized and exceeded quickly.
Flag Pattern Candlestick
The rationale behind the formation of the flag pattern is an increase in the demand or supply forces which move the price either up or down. These areas are characteristic of upward trends or downward trends and may be considered as pressure areas.
In this case, the trend may not change into an opposite trend and is only modified to a side trend which is a range-bound, or a neutral trend.
These areas offer minor targets or minor support and resistance where traders are looking for profits. When the target area or resistance area approached in an uptrend, the selling increases.
An increase in supply stops price rise and the supply is absorbed by strong demand. In this case, the price may either remain horizontal or maybe retraced to a small extent.
In this case, the number of candlesticks may be either stacked horizontally or may swing down a little.
Trend lines which are drawn above highs and below lows of the price bars are capable of achieving horizontal, parallel, and downward sloping trend lines.
Vertical lines which are drawn at the beginning or end of these trend lines help achieve either a rectangle or a downward sloping parallelogram. The price bars occurring before the flag resemble the post of the flag and are bullish flag patterns.
Subsequent to the selling activity, the bullish activity is visible.
When demand exceeds supply, price breaks are experienced outside the flag pattern towards its upside, causing the upward trend to continue.
In the case of the downward trend, when the support area or target areas are approached, an increase in the buying activity is experienced.
Price fall stops after an increase in demand is experienced. A strong supply absorbs demand.
Subsequently, prices may either remain horizontal or vary a little. This means that a large number of candlesticks may be stacked in a horizontal manner or may experience a small swing upward.
When trend lines occur below the lows and above the highs for price bars, we get horizontal or parallel or upward sloping trend lines. Vertical lines which are drawn either at the beginning or at the end of the trend lines result in a sloping parallelogram or a rectangle.
These patterns are bearish flag patterns. The price bars preceding the flag appear similar to the flag post.
In the various forms of the pattern, the appearance is that of a flag post held upside down. These patterns are also referred to as reverse flag patterns.
The bearish activity prevails after the buying is complete. When supply exceeds the demand, price breakouts are experienced beyond the flag pattern and towards a downward side. In this way, the trend continues.
Flag Patterns Target
A sharp price move creates a flag, which is succeeded by a consolidation that runs between parallel lines. A breakout can occur in the opposite direction of a typical shark move, even in the same direction.
A stop-loss is created outside the flag on the side which is opposite to the breakout.
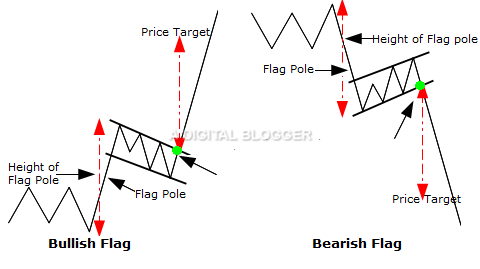
Either one of the two targets are used in this case. One of the targets is weight based on the flag height and another is based on the pole height.
These patterns are generally best for trading during volatile times in a day, such as between 1300 and 1600 GMT or between 0700 and 2000 GMT.
A flag pattern gives ample opportunity to stock traders for entering or re-entering a market. Flag patterns serve as stop stations in a continuing trend.
The trend may either stop or retrace itself so that a trend reversal is evident. Flag patterns are characteristic of horizontal or neutral markets with trading volume decreasing or remaining as is.
In case you are thinking of getting started with stock market investments or trading, let us assist you in taking the next steps forward:
More on Share Market Education
In case you are looking to learn more about Chart Patterns, here are some reference articles for you:
Summary
Reviewer
A Digital Blogger
Date
Broker Name
Flag Pattern
Overall Rating
