


Looking for Low Brokerage, High Margin & Free Tips?
Morning Star Pattern
| | Chart Patterns | No Comments
More Chart Patterns
Morning star pattern is another form of a bullish bottom reversal pattern. A morning star candlestick pattern can successfully predict or explain trends in price movements in the case of securities/equity, currency trading, or financial derivatives.
It is a warning signal which appears when there is a weakness in a downtrend.
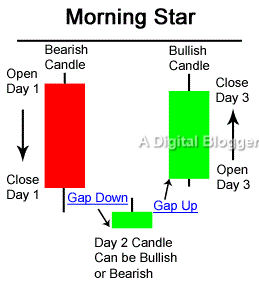
While the first candle is dark with a large body, the third candle has a lighter body. The middle candle is a star candle with a short body.
Differences also exist in gaps between the three candlesticks. The star candle in this pattern may not be below the low point of the darker candlestick and may exist within its lower shadow as well. The star is a representation of weakness identifying that sellers were not able to achieve a price lower than the close during the previous period.
The third candlestick acts as a confirmation for the pattern formation as it is expected to close into the body of the first one. The pattern provides a strong confirmation signal for traders who may not wait to see the status of the fourth candle before investing in the stock.
Morning Star Pattern Screener
During technical analysis, analysts view the morning star pattern in the form of a bullish trading signal after a downward trend. Once a morning star pattern is spotted, investors may follow it closely and take advantage of a positive trend reversal situation.
The morning star pattern, in conjunction with other technical measures, helps investors execute positive buying decisions for profitability as soon as a trend reversal takes place. Size assessments of the candlestick are an important determinant for reversal potential in the trend line.
Two other important aspects of the morning star pattern are the gap up and gap down openings.
The gap up opening is an indication of the buyers’ enthusiasm. This means that buyers are likely to purchase stocks at a price higher than the close of the previous day. As a result, the opening price of the stock for the next day is more than the close for the previous day.
A situation like this results when the position of stocks is so favourable that buyers agree to purchase the stock at any price. A price increase is experienced and this is referred to as gap up opening. Gap up openings are always bullish in nature.
On the other hand, when the bears get more enthusiastic, a gap down opening occurs.
To elaborate, this situation motivates the bears to sell at a price lower than the close of the previous day. Gap down is characteristic to scenarios where sellers intend to move their stock and are willing to lower their price. Therefore, gap down is bearish in nature.
Morning Star Pattern Formation
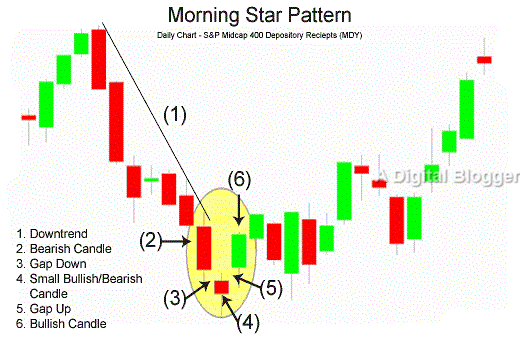
The morning star is a characteristic three-candlestick pattern with the middle one forming the star. The first large bearish candle is spotted on the first day of the morning star pattern.
This is followed by the small candlestick for the second day which may be either a bullish or bearish. Finally, the candlestick for the third day is a large bullish candle.
The strength of the pattern can be gauged from the size of the candlesticks. When a big bearish candlestick is formed on the first day, as part of a downward trend, the representation illustrates the control of the bears. After this, a gap down indicates that while the bears are still controlling the market they are not able to lower the prices any further. Hence, their strength seems to be diminishing.
If there is a bullish candlestick on the second day, the weakness of the bears is clearly manifested. Finally, the long bullish candlestick of the third day confirms the strong bullish force, and this is accompanied by a gap up. The completion of this pattern initiates a reversal and a buy signal.
Judging the strength of the morning star pattern involves checking for signs that indicate a flip over in the market sentiment. In this case, it refers to a change in sentiment from bearish to bullish. The nature of the first candle confirms that sellers push down prices to a new low point at the open and close of a candle.
While the middle candle can be dark or light, its body size matters. A short body with a long lower and upper shadow refers to a strong buying sentiment which causes a tentative reversal. The final decision rests on the third candle which is also called the recovery candle.
The third candlestick is always bullish, marking the beginning of a turnaround of events and a sustained bullish trend.
Morning Star Pattern Reliability
When the third candlestick opens over and above the body of the star candlestick and a gap exist between the body of the star and that of the third candlestick, the pattern is considered more reliable. However, this situation is not witnessed frequently.
Another important measure of reliability is how far the body of the third candlestick pierces into the body of the first one. When the volume of the first candlestick is below average and the volume of the third one is above the established average, the reliability is enhanced even further.
Similar to any other stock trading pattern, the reliability of a morning star pattern can also be enhanced through the use of several technical indicators such as MACD, RSI, stochastic, and volume.
Morning Star Pattern Signals
Given that the morning star candlestick pattern is a strong signal for a price reversal, it is central to the trading strategy of the majority of investors.
However, the pattern can be tricky when it is not used correctly. It is important to understand that traders have dissimilar perceptions of a downtrend. Some traders consider that lower highs and lower lows ideally illustrate downtrends. Others look for a short streak of lower candlesticks placed consecutively.
Forex traders understand morning star patterns as a variation of the bullish engulfing pattern. The only difference is that the middle candle is expected to be a low range candle such as the Doji pattern. In a non-forex morning star pattern, the middle candle must be located at an isolated point with respect to the other two candles.
In this case, the second candle maybe either bearish, bullish, or doji. However, the second candle is not an inside bar or a Harami candle. In the non-forex arrangement, the third candle opens at or below the second candle of the pattern. The third candle must not engulf the second candle and must leave it isolated.
Trading correctly with morning star patterns is dependent on identifying the context accurately. Once a downtrend is established, the morning star candlestick pattern can be traded with success and is very profitable. This pattern could be part of the main trading setup for many traders.
Forex trading requires that the second candle is either bearish or doji. The third candlestick must be close to at least the top half of the first candlestick. It can be larger so as to engulf the previous two candlesticks or even more in the downtrend.
Morning Star Pattern Reversal
The morning star pattern reversal completes in three trading sessions overall (as explained above).
This reversal is imminent but you need to be a little patient to see the overall pattern unfolding itself. Day 2 will most likely take care of all of your doubts when the gap begins to take place from the bearish trend the previous day.
Day 3 will be all bullish.
An opposite trend to what happens in the morning star pattern happens in the evening star pattern where the reversal takes place towards a bearish momentum.
Conclusion
Downward waves in stock trends most probably contain morning star patterns. These waves are brief in nature and a bearish trend may be encountered shortly afterwards. Downtrends spell favourable market situations for buying assets.
Uncertainty exists with respect to the nature of selling in the market and the point at which it will level off. When there is indecision in the stock market space, a clear-cut signal is evident through the morning star pattern as it confirms the beginning of a bullish reversal.
Predicting a future state of the market is an important advantage of studying morning star patterns. Once the traders have identified a morning star pattern and the strength of the reversal signal is apparent, they can confirm with a certain degree of confidence that the market is about to move upward in a reversal trend.
It either helps traders to start buying early or wait until the next upward trend appears with a higher trading price. Whatever the case may be, the morning star pattern serves as a convenient mechanism for spotting reversal trends that move upward.
Predicting market state by spotting morning star patterns does not require the use of any specific technical indicators. However, the movement of candlestick patterns must be clearly understood for accurate trend analysis.
In case you are thinking of getting started with stock market investments or trading, let us assist you in taking the next steps forward:
More on Share Market Education
In case you are looking to learn more about Chart Patterns, here are some reference articles for you:
Summary
Reviewer
A Digital Blogger
Date
Broker Name
Morning Star Pattern
Overall Rating
