


Looking for Low Brokerage, High Margin & Free Tips?
Put Call Ratio
| | Derivatives | No Comments
More on Derivatives
Put Call Ratio is one of the most promising tools (also can be used as an indicator) that is trusted by a range of traders when they are looking to get a quick idea of the options market movement and direction.
In this detailed review, we will have a look at how Put Call Ratio works and how you can make the best use of it in order to perform your stock market analysis.
But first, let’s start with the basics!
Options trading and share market trading, in general, can be a volatile and risky mechanism, especially for beginner level traders who don’t have much of an idea about how things work. Any statement or prediction of stock market that was true a minute ago may not stay the same.
Markets and market sentiments keep moving up and down, and quite fast to that.
Every trader wishes to know what the other participants in the market are doing at the moment so that he can predict the future movement of the market as accurately as possible.
This wish gets answered, as closely as possible, in the form of Put Call Ratio.
Put Call Ratio Meaning
Put Call Ratio is the most commonly used derivative indicator which is specially designed and used to gauge and understand the sentiment of the options market.
It is one of the most reliable measures to understand the current market scenario and to predict the future price movement based on it.
This ratio is a contrarian indicator, which means that it looks at the ratio of put and call options in the market and helps the options traders to judge if the rise or the fall in the market is excessive, and then based on this information, the traders can take a contrarian call.
If there are more put options traded than call options, it means that the market is selling and is bearish and if the call options are traded more, it means that the market is buying and is bullish.
However, it means the opposite of a contrarian.
To a contrarian, bearish sentiment means that the market is expected to reach the bottom and will then rise up, so they buy and bullish sentiment means that the market will reach its top soon and will start falling, so they sell.
Put Call Ratio Calculation
The put-call ratio can be calculated either by using open interest in put-call options or the volume of put-call options.
- Open Interest Put Call Ratio: This is calculated by dividing total open interest into all available put options in a given day by total open interest in all available call options for the given day. Before that, you need to make sure that the open interest calculated by you is also correct.
- Volume Put Call Ratio: This is calculated by simply dividing the volume of all put options traded by the volume of call options traded.
This Ratio can be calculated for a particular stock, for an index or for the entire derivative segment.
For example, for Nifty50 in the month of January, at the strike price of 7000, the volume of put options was 28,273 for a day and on the same day with same strike price and same expiry date, the volume of call options was 88,220.
PCR (volume) = Put Options Volume/call Options Volume = 28273/88200 i.e. 0.32
Put Call Ratio Interpretation
Put Call ratio is a contrarian indicator.
According to short-term traders, PCR usually moves in the wrong direction. When PCR is at its extremes, low or high, it indicates clear market sentiments. The contrarian traders take a call against what is indicated by the put-call ratio.
For instance, when this ratio is extremely high, it indicates that the volume of put options is more than the call options, and the other participants in the market are selling the securities making the market bearish.
However, the contrarian trader takes this as an indication that the market has gone too low and there are not many buyers left, so the market is bound to come up soon and they take contrary positions.
A high ratio in a falling market is considered bearish, but a high ratio in the rising market is considered bullish.
| Put Call Ratio | Indication | Sentiment | What this means for Contrarians |
| Close to or greater than 1 | More selling than buying | Bearish | Market may soon bottom out and then go up |
| Much less than 1 | More buying than selling | Bullish | Market top is in making and will go down soon |
| PCR rising in up-trending market | Put writers are aggressively writing | Bullish | To look for a retracement and sell |
| PCR rising steadily all day | More selling than buying | Bullish | Sell |
| PCR declining when the market is at resistance level | Bulls are afraid of bears | Bearish | Call writers building fresh positions and expecting price increase; time to buy |
| PCR declining in down trending market | More buying than selling, call writers are aggressively writing | Bearish | Time to buy |
Thus, we can observe that the put-call ratio serves as an excellent indicator to take calls in a volatile short-term market on whether to buy or sell the options.
It takes into account the most important aspect-the sentiments or the mood of the market, and based on that future movement in the price of the securities can be predicted.
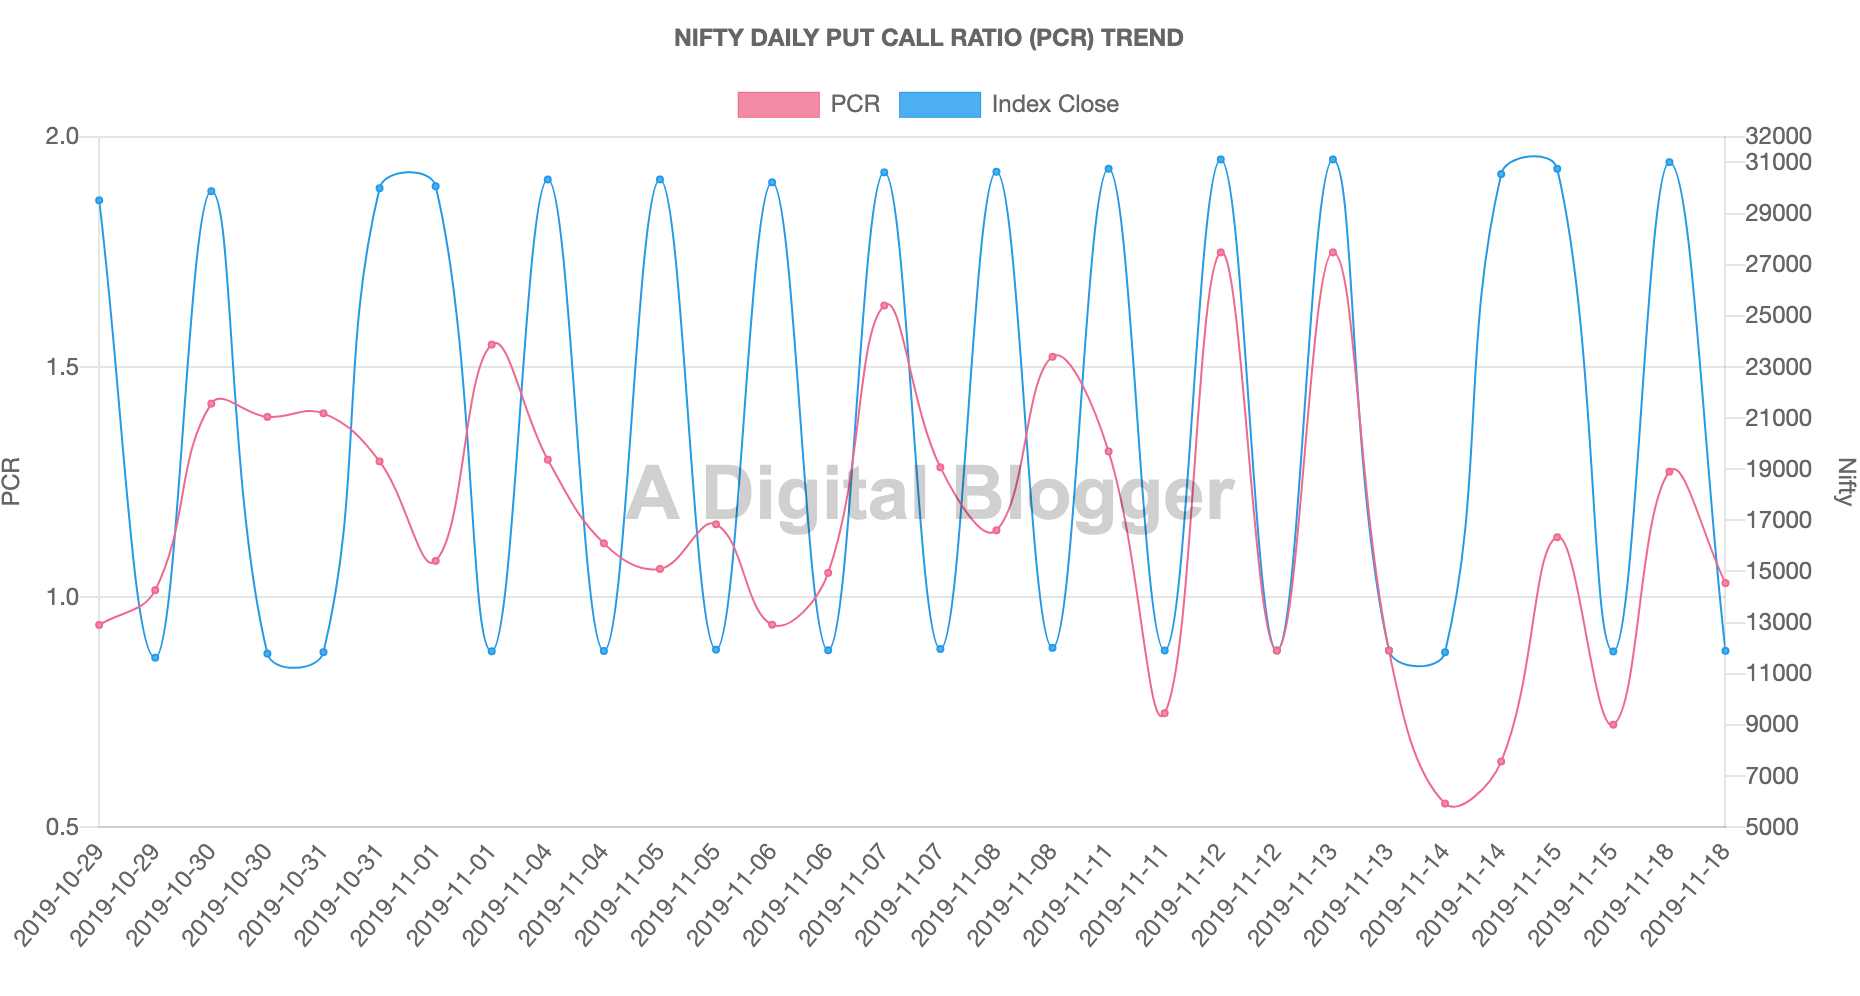
Put Call Ratio Chart
A put-call ratio chart is an important tool for gauging the overall sentiment of the market.
As we know that higher this ratio, higher is the fear and confusion in the market among traders and investors. When you are down to analyzing this ratio in the charts, make sure you understand this basic relation.
If this ratio is higher than 1, this implies more puts are being bought as compared to the calls. However, if the ratio is lower than 1 than obviously, it is the other way around.
Also, a higher put-call ratio implies that the market is going to be bearish in the near future while the sentiment is bullish in the case of lower ratio.
Here is a quick glimpse of how a put-call ratio chart looks like:
Put Call Ratio Formula
Like mentioned above in the calculation section, the put-call ratio formula can be simply calculated in 2 ways.
1. Put Call Ratio = Number of Puts / Number of Calls i.e. Put Volume / Call Volume
For example, if the number of puts initiated in the market is in the range of 1500 and the number of calls initiated in the market is 1800, then this ratio will be = 1500/1800 or 0.833.
2. Put Call Ratio = Total Put Open Interest / Total Call Open Interest
For instance, if the total put open interest is 2.5 and the total call open interest is 3.0, then the put-call ratio, in this case, will be 2.5/3 = 0.833.
In the next section, we will try to understand what these values imply to you. Or, simply said, what information you can extract for the calculations done.
Put Call Ratio Analysis
As discussed in the calculations above, we have the value of the put-call ratio as 0.833. Now, what does that mean?
- If the value of the ratio is more than 1, there is a sense of fear in the market and the sentiment is bearish.
- If the value of the ratio is less than 1, there is a sense of confidence in the market and the sentiment is bullish.
- If the value of the ratio is equal to 1, there is a sense of neutrality in the market and the sentiment is neutral.
Although there is no specific rule, however, as per trading experts, a value of 0.7 for the put-call ratio is assumed to be relatively strong towards the market while anything more than 1 is considered to be a sentiment of market-fall.
Put Call Ratio OI
Here are the latest Put Call Ratio across different stocks (at the OI level):
Last Updated: 28th July 2026
| Symbol | Put | Call | Ratio |
|---|---|---|---|
| OIL | 105,369.00 | 37,389.00 | 2.82 |
| AJANTPHARM | 21,000.00 | 16,000.00 | 1.31 |
| ZEEL | 2,484,300.00 | 2,043,600.00 | 1.22 |
| NESTLEIND | 2,600.00 | 2,200.00 | 1.18 |
| CHOLAFIN | 16,500.00 | 15,500.00 | 1.06 |
| BERGEPAINT | 61,600.00 | 59,400.00 | 1.04 |
| RECLTD | 5,358,000.00 | 5,190,000.00 | 1.03 |
| CONCOR | 18,750.00 | 18,750.00 | 1.00 |
| SIEMENS | 11,000.00 | 11,500.00 | 0.96 |
| DISHTV | 3,328,000.00 | 3,528,000.00 | 0.94 |
| BALKRISIND | 262,400.00 | 278,400.00 | 0.94 |
| SBIN | 16,380,000.00 | 17,679,000.00 | 0.93 |
| JETAIRWAYS | 1,188,000.00 | 1,312,800.00 | 0.90 |
| EQUITAS | 620,000.00 | 700,000.00 | 0.89 |
| HEROMOTOCO | 240,600.00 | 285,400.00 | 0.84 |
| TITAN | 1,845,750.00 | 2,220,000.00 | 0.83 |
| HAVELLS | 407,000.00 | 491,000.00 | 0.83 |
| IDBI | 22,220,000.00 | 27,130,000.00 | 0.82 |
| WIPRO | 1,363,200.00 | 1,684,800.00 | 0.81 |
| TATAMTRDVR | 1,778,000.00 | 2,209,200.00 | 0.80 |
| GODREJIND | 28,500.00 | 36,000.00 | 0.79 |
| AXISBANK | 5,722,800.00 | 7,228,800.00 | 0.79 |
| INFRATEL | 345,100.00 | 440,300.00 | 0.78 |
| BRITANNIA | 33,600.00 | 44,200.00 | 0.76 |
| PVR | 41,200.00 | 56,000.00 | 0.74 |
| TATACHEM | 131,250.00 | 179,250.00 | 0.73 |
| KSCL | 100,500.00 | 138,000.00 | 0.73 |
| PIDILITIND | 176,000.00 | 242,000.00 | 0.73 |
| DHFL | 5,221,500.00 | 7,230,000.00 | 0.72 |
| ADANIPOWER | 3,220,000.00 | 4,480,000.00 | 0.72 |
| RPOWER | 6,006,000.00 | 8,385,000.00 | 0.72 |
| SRTRANSFIN | 310,800.00 | 439,800.00 | 0.71 |
| NMDC | 1,566,000.00 | 2,220,000.00 | 0.71 |
| KOTAKBANK | 1,452,800.00 | 2,060,000.00 | 0.71 |
| IBULHSGFIN | 984,000.00 | 1,400,000.00 | 0.70 |
| ADANIPORTS | 1,707,500.00 | 2,445,000.00 | 0.70 |
| PETRONET | 564,000.00 | 813,000.00 | 0.69 |
| LICHSGFIN | 706,200.00 | 1,026,300.00 | 0.69 |
| EXIDEIND | 984,000.00 | 1,440,000.00 | 0.68 |
| TATAGLOBAL | 987,750.00 | 1,473,750.00 | 0.67 |
| SRF | 56,000.00 | 84,000.00 | 0.67 |
| ICICIBANK | 13,103,750.00 | 19,695,500.00 | 0.67 |
| HCLTECH | 501,900.00 | 755,300.00 | 0.66 |
| ADANIENT | 2,116,000.00 | 3,208,000.00 | 0.66 |
| JUSTDIAL | 645,400.00 | 978,600.00 | 0.66 |
| RAYMOND | 136,800.00 | 208,000.00 | 0.66 |
| IGL | 481,250.00 | 734,250.00 | 0.66 |
| CIPLA | 445,000.00 | 679,000.00 | 0.66 |
| NIITTECH | 208,500.00 | 326,250.00 | 0.64 |
| JSWSTEEL | 2,535,000.00 | 4,008,000.00 | 0.63 |
| DRREDDY | 204,500.00 | 326,500.00 | 0.63 |
| TATASTEEL | 3,911,907.00 | 6,324,621.00 | 0.62 |
| AUROPHARMA | 1,088,000.00 | 1,768,000.00 | 0.62 |
| BAJFINANCE | 1,767,500.00 | 2,900,000.00 | 0.61 |
| LUPIN | 815,500.00 | 1,351,700.00 | 0.60 |
| BANKINDIA | 3,012,000.00 | 5,016,000.00 | 0.60 |
| HINDUNILVR | 646,800.00 | 1,103,400.00 | 0.59 |
| MRPL | 234,000.00 | 405,000.00 | 0.58 |
| AMBUJACEM | 837,500.00 | 1,450,000.00 | 0.58 |
| CAPF | 128,800.00 | 224,000.00 | 0.58 |
| ASIANPAINT | 324,000.00 | 565,800.00 | 0.57 |
| COALINDIA | 1,020,800.00 | 1,793,000.00 | 0.57 |
| BHARATFORG | 252,000.00 | 446,400.00 | 0.56 |
| RELCAPITAL | 2,671,500.00 | 4,747,500.00 | 0.56 |
| NTPC | 1,508,000.00 | 2,688,000.00 | 0.56 |
| FEDERALBNK | 4,070,000.00 | 7,298,500.00 | 0.56 |
| MFSL | 40,800.00 | 73,200.00 | 0.56 |
| MINDTREE | 352,800.00 | 633,600.00 | 0.56 |
| INFY | 3,202,800.00 | 5,766,000.00 | 0.56 |
| SAIL | 12,336,000.00 | 22,284,000.00 | 0.55 |
| BHEL | 4,980,000.00 | 9,000,000.00 | 0.55 |
| SUNTV | 357,000.00 | 655,000.00 | 0.55 |
| DIVISLAB | 176,800.00 | 328,000.00 | 0.54 |
| VOLTAS | 477,000.00 | 887,000.00 | 0.54 |
| RELINFRA | 1,370,200.00 | 2,548,000.00 | 0.54 |
| TV18BRDCST | 1,343,000.00 | 2,499,000.00 | 0.54 |
| IDFC | 4,461,600.00 | 8,316,000.00 | 0.54 |
| PNB | 13,282,500.00 | 24,964,500.00 | 0.53 |
| YESBANK | 19,341,000.00 | 36,671,250.00 | 0.53 |
| MUTHOOTFIN | 177,000.00 | 336,000.00 | 0.53 |
| GODREJCP | 99,600.00 | 189,600.00 | 0.53 |
| TVSMOTOR | 308,000.00 | 588,000.00 | 0.52 |
| MCDOWELL-N | 237,500.00 | 453,750.00 | 0.52 |
| CADILAHC | 248,000.00 | 476,800.00 | 0.52 |
| ONGC | 4,661,250.00 | 8,981,250.00 | 0.52 |
| BHARATFIN | 31,000.00 | 60,000.00 | 0.52 |
| AMARAJABAT | 43,400.00 | 84,000.00 | 0.52 |
| JUBLFOOD | 304,500.00 | 590,000.00 | 0.52 |
| UNIONBANK | 2,226,000.00 | 4,392,000.00 | 0.51 |
| CEATLTD | 57,400.00 | 113,400.00 | 0.51 |
| TCS | 2,386,000.00 | 4,716,500.00 | 0.51 |
| M&MFIN | 270,000.00 | 535,000.00 | 0.50 |
| HDFCBANK | 1,640,000.00 | 3,259,000.00 | 0.50 |
| IOC | 3,861,000.00 | 7,713,000.00 | 0.50 |
| PCJEWELLER | 2,602,500.00 | 5,238,000.00 | 0.50 |
| DLF | 4,427,500.00 | 8,912,500.00 | 0.50 |
| SREINFRA | 1,064,000.00 | 2,149,000.00 | 0.50 |
| CANBK | 1,148,000.00 | 2,336,000.00 | 0.49 |
| NATIONALUM | 6,016,000.00 | 12,296,000.00 | 0.49 |
| GAIL | 1,125,474.00 | 2,301,621.00 | 0.49 |
| BAJAJFINSV | 39,250.00 | 80,500.00 | 0.49 |
| BATAINDIA | 299,200.00 | 621,500.00 | 0.48 |
| PEL | 104,190.00 | 216,836.00 | 0.48 |
| RELIANCE | 9,341,000.00 | 19,521,000.00 | 0.48 |
| IFCI | 3,000,000.00 | 6,325,000.00 | 0.47 |
| ICICIPRULI | 149,500.00 | 318,500.00 | 0.47 |
| TORNTPOWER | 111,000.00 | 237,000.00 | 0.47 |
| HDFC | 653,000.00 | 1,402,000.00 | 0.47 |
| SOUTHBANK | 4,938,009.00 | 10,638,261.00 | 0.46 |
| ASHOKLEY | 7,664,000.00 | 16,576,000.00 | 0.46 |
| INDUSINDBK | 343,500.00 | 756,000.00 | 0.45 |
| APOLLOTYRE | 1,371,000.00 | 3,039,000.00 | 0.45 |
| MARICO | 143,000.00 | 317,200.00 | 0.45 |
| ARVIND | 1,116,000.00 | 2,500,000.00 | 0.45 |
| UPL | 387,600.00 | 868,800.00 | 0.45 |
| TECHM | 849,600.00 | 1,905,600.00 | 0.45 |
| SUZLON | 10,215,000.00 | 22,950,000.00 | 0.45 |
| SUNPHARMA | 2,648,800.00 | 5,987,300.00 | 0.44 |
| INDIGO | 254,400.00 | 575,400.00 | 0.44 |
| LT | 2,101,500.00 | 4,814,250.00 | 0.44 |
| TATAPOWER | 2,169,000.00 | 4,995,000.00 | 0.43 |
| KTKBANK | 1,138,500.00 | 2,623,500.00 | 0.43 |
| ORIENTBANK | 294,000.00 | 684,000.00 | 0.43 |
| BAJAJ-AUTO | 255,250.00 | 594,250.00 | 0.43 |
| UJJIVAN | 230,400.00 | 544,000.00 | 0.42 |
| HINDPETRO | 3,435,075.00 | 8,178,975.00 | 0.42 |
| JINDALSTEL | 3,105,000.00 | 7,395,750.00 | 0.42 |
| TATAMOTORS | 12,708,000.00 | 30,355,500.00 | 0.42 |
| JISLJALEQS | 3,078,000.00 | 7,353,000.00 | 0.42 |
| ULTRACEMCO | 41,800.00 | 100,600.00 | 0.42 |
| GMRINFRA | 8,955,000.00 | 21,690,000.00 | 0.41 |
| L&TFH | 4,603,500.00 | 11,290,500.00 | 0.41 |
| IRB | 492,500.00 | 1,212,500.00 | 0.41 |
| HEXAWARE | 300,000.00 | 742,500.00 | 0.40 |
| INDIANB | 222,000.00 | 552,000.00 | 0.40 |
| BANKBARODA | 8,296,000.00 | 20,676,000.00 | 0.40 |
| RBLBANK | 304,800.00 | 811,200.00 | 0.38 |
| HINDZINC | 249,600.00 | 665,600.00 | 0.38 |
| HINDALCO | 5,008,500.00 | 13,569,500.00 | 0.37 |
| BHARTIARTL | 1,139,000.00 | 3,095,700.00 | 0.37 |
| ESCORTS | 465,300.00 | 1,267,200.00 | 0.37 |
| NHPC | 2,025,000.00 | 5,589,000.00 | 0.36 |
| ALBK | 528,000.00 | 1,474,000.00 | 0.36 |
| ITC | 6,592,800.00 | 18,436,800.00 | 0.36 |
| COLPAL | 15,400.00 | 43,400.00 | 0.35 |
| CESC | 126,500.00 | 357,500.00 | 0.35 |
| BPCL | 1,638,000.00 | 4,696,200.00 | 0.35 |
| INDIACEM | 2,194,500.00 | 6,300,000.00 | 0.35 |
| VEDL | 4,403,000.00 | 12,663,000.00 | 0.35 |
| MARUTI | 521,775.00 | 1,531,500.00 | 0.34 |
| MOTHERSUMI | 876,800.00 | 2,600,000.00 | 0.34 |
| APOLLOHOSP | 29,500.00 | 88,000.00 | 0.34 |
| POWERGRID | 872,000.00 | 2,616,000.00 | 0.33 |
| BEML | 51,000.00 | 160,500.00 | 0.32 |
| BEL | 2,316,600.00 | 7,345,800.00 | 0.32 |
| GRASIM | 250,500.00 | 798,000.00 | 0.31 |
| PFC | 2,820,000.00 | 9,006,000.00 | 0.31 |
| EICHERMOT | 21,525.00 | 69,675.00 | 0.31 |
| M&M | 1,189,000.00 | 3,856,000.00 | 0.31 |
| HCC | 918,000.00 | 3,006,000.00 | 0.31 |
| ACC | 109,200.00 | 358,000.00 | 0.31 |
| CASTROLIND | 190,400.00 | 627,200.00 | 0.30 |
| IDFCBANK | 4,587,000.00 | 15,158,000.00 | 0.30 |
| MCX | 41,300.00 | 138,600.00 | 0.30 |
| NCC | 2,528,000.00 | 8,552,000.00 | 0.30 |
| MANAPPURAM | 774,000.00 | 2,640,000.00 | 0.29 |
| ENGINERSIN | 336,000.00 | 1,162,000.00 | 0.29 |
| DABUR | 355,000.00 | 1,285,000.00 | 0.28 |
| KAJARIACER | 7,000.00 | 26,000.00 | 0.27 |
| CENTURYTEX | 91,300.00 | 339,350.00 | 0.27 |
| WOCKPHARMA | 94,500.00 | 355,500.00 | 0.27 |
| BIOCON | 376,200.00 | 1,483,200.00 | 0.25 |
| NBCC | 732,000.00 | 3,030,000.00 | 0.24 |
| TATAELXSI | 268,800.00 | 1,172,000.00 | 0.23 |
| IDEA | 7,119,000.00 | 31,094,000.00 | 0.23 |
| SYNDIBANK | 495,000.00 | 2,268,000.00 | 0.22 |
| CGPOWER | 276,000.00 | 1,272,000.00 | 0.22 |
| DCBBANK | 63,000.00 | 292,500.00 | 0.22 |
| RCOM | 6,860,000.00 | 32,088,000.00 | 0.21 |
| MGL | 16,200.00 | 77,400.00 | 0.21 |
| JPASSOCIAT | 4,556,000.00 | 22,474,000.00 | 0.20 |
| INFIBEAM | 2,288,000.00 | 11,308,000.00 | 0.20 |
| GLENMARK | 60,000.00 | 302,000.00 | 0.20 |
| CANFINHOME | 108,750.00 | 633,750.00 | 0.17 |
| PTC | 88,000.00 | 608,000.00 | 0.14 |
| KPIT | 166,500.00 | 1,251,000.00 | 0.13 |
| STAR | 53,600.00 | 434,400.00 | 0.12 |
| UBL | 11,200.00 | 115,500.00 | 0.10 |
| GRANULES | 80,000.00 | 975,000.00 | 0.08 |
| GSFC | 90,000.00 | 1,458,000.00 | 0.06 |
| CUMMINSIND | 2,100.00 | 60,200.00 | 0.03 |
| TATACOMM | 1,600.00 | 48,800.00 | 0.03 |
| CHENNPETRO | 1,500.00 | 109,500.00 | 0.01 |
Put Call Ratio – Volume Level
Here are the latest Put Call Ratio across different stocks (at Volume level):
Last Updated: 28th July 2026
| Symbol | Put | Call | Ratio |
|---|---|---|---|
| OIL | 105,369.00 | 37,389.00 | 2.82 |
| AJANTPHARM | 21,000.00 | 16,000.00 | 1.31 |
| ZEEL | 2,484,300.00 | 2,043,600.00 | 1.22 |
| NESTLEIND | 2,600.00 | 2,200.00 | 1.18 |
| CHOLAFIN | 16,500.00 | 15,500.00 | 1.06 |
| BERGEPAINT | 61,600.00 | 59,400.00 | 1.04 |
| RECLTD | 5,358,000.00 | 5,190,000.00 | 1.03 |
| CONCOR | 18,750.00 | 18,750.00 | 1.00 |
| SIEMENS | 11,000.00 | 11,500.00 | 0.96 |
| DISHTV | 3,328,000.00 | 3,528,000.00 | 0.94 |
| BALKRISIND | 262,400.00 | 278,400.00 | 0.94 |
| SBIN | 16,380,000.00 | 17,679,000.00 | 0.93 |
| JETAIRWAYS | 1,188,000.00 | 1,312,800.00 | 0.90 |
| EQUITAS | 620,000.00 | 700,000.00 | 0.89 |
| HEROMOTOCO | 240,600.00 | 285,400.00 | 0.84 |
| TITAN | 1,845,750.00 | 2,220,000.00 | 0.83 |
| HAVELLS | 407,000.00 | 491,000.00 | 0.83 |
| IDBI | 22,220,000.00 | 27,130,000.00 | 0.82 |
| WIPRO | 1,363,200.00 | 1,684,800.00 | 0.81 |
| TATAMTRDVR | 1,778,000.00 | 2,209,200.00 | 0.80 |
| GODREJIND | 28,500.00 | 36,000.00 | 0.79 |
| AXISBANK | 5,722,800.00 | 7,228,800.00 | 0.79 |
| INFRATEL | 345,100.00 | 440,300.00 | 0.78 |
| BRITANNIA | 33,600.00 | 44,200.00 | 0.76 |
| PVR | 41,200.00 | 56,000.00 | 0.74 |
| TATACHEM | 131,250.00 | 179,250.00 | 0.73 |
| KSCL | 100,500.00 | 138,000.00 | 0.73 |
| PIDILITIND | 176,000.00 | 242,000.00 | 0.73 |
| DHFL | 5,221,500.00 | 7,230,000.00 | 0.72 |
| ADANIPOWER | 3,220,000.00 | 4,480,000.00 | 0.72 |
| RPOWER | 6,006,000.00 | 8,385,000.00 | 0.72 |
| SRTRANSFIN | 310,800.00 | 439,800.00 | 0.71 |
| NMDC | 1,566,000.00 | 2,220,000.00 | 0.71 |
| KOTAKBANK | 1,452,800.00 | 2,060,000.00 | 0.71 |
| IBULHSGFIN | 984,000.00 | 1,400,000.00 | 0.70 |
| ADANIPORTS | 1,707,500.00 | 2,445,000.00 | 0.70 |
| PETRONET | 564,000.00 | 813,000.00 | 0.69 |
| LICHSGFIN | 706,200.00 | 1,026,300.00 | 0.69 |
| EXIDEIND | 984,000.00 | 1,440,000.00 | 0.68 |
| TATAGLOBAL | 987,750.00 | 1,473,750.00 | 0.67 |
| SRF | 56,000.00 | 84,000.00 | 0.67 |
| ICICIBANK | 13,103,750.00 | 19,695,500.00 | 0.67 |
| HCLTECH | 501,900.00 | 755,300.00 | 0.66 |
| ADANIENT | 2,116,000.00 | 3,208,000.00 | 0.66 |
| JUSTDIAL | 645,400.00 | 978,600.00 | 0.66 |
| RAYMOND | 136,800.00 | 208,000.00 | 0.66 |
| IGL | 481,250.00 | 734,250.00 | 0.66 |
| CIPLA | 445,000.00 | 679,000.00 | 0.66 |
| NIITTECH | 208,500.00 | 326,250.00 | 0.64 |
| JSWSTEEL | 2,535,000.00 | 4,008,000.00 | 0.63 |
| DRREDDY | 204,500.00 | 326,500.00 | 0.63 |
| TATASTEEL | 3,911,907.00 | 6,324,621.00 | 0.62 |
| AUROPHARMA | 1,088,000.00 | 1,768,000.00 | 0.62 |
| BAJFINANCE | 1,767,500.00 | 2,900,000.00 | 0.61 |
| LUPIN | 815,500.00 | 1,351,700.00 | 0.60 |
| BANKINDIA | 3,012,000.00 | 5,016,000.00 | 0.60 |
| HINDUNILVR | 646,800.00 | 1,103,400.00 | 0.59 |
| MRPL | 234,000.00 | 405,000.00 | 0.58 |
| AMBUJACEM | 837,500.00 | 1,450,000.00 | 0.58 |
| CAPF | 128,800.00 | 224,000.00 | 0.58 |
| ASIANPAINT | 324,000.00 | 565,800.00 | 0.57 |
| COALINDIA | 1,020,800.00 | 1,793,000.00 | 0.57 |
| BHARATFORG | 252,000.00 | 446,400.00 | 0.56 |
| RELCAPITAL | 2,671,500.00 | 4,747,500.00 | 0.56 |
| NTPC | 1,508,000.00 | 2,688,000.00 | 0.56 |
| FEDERALBNK | 4,070,000.00 | 7,298,500.00 | 0.56 |
| MFSL | 40,800.00 | 73,200.00 | 0.56 |
| MINDTREE | 352,800.00 | 633,600.00 | 0.56 |
| INFY | 3,202,800.00 | 5,766,000.00 | 0.56 |
| SAIL | 12,336,000.00 | 22,284,000.00 | 0.55 |
| BHEL | 4,980,000.00 | 9,000,000.00 | 0.55 |
| SUNTV | 357,000.00 | 655,000.00 | 0.55 |
| DIVISLAB | 176,800.00 | 328,000.00 | 0.54 |
| VOLTAS | 477,000.00 | 887,000.00 | 0.54 |
| RELINFRA | 1,370,200.00 | 2,548,000.00 | 0.54 |
| TV18BRDCST | 1,343,000.00 | 2,499,000.00 | 0.54 |
| IDFC | 4,461,600.00 | 8,316,000.00 | 0.54 |
| PNB | 13,282,500.00 | 24,964,500.00 | 0.53 |
| YESBANK | 19,341,000.00 | 36,671,250.00 | 0.53 |
| MUTHOOTFIN | 177,000.00 | 336,000.00 | 0.53 |
| GODREJCP | 99,600.00 | 189,600.00 | 0.53 |
| TVSMOTOR | 308,000.00 | 588,000.00 | 0.52 |
| MCDOWELL-N | 237,500.00 | 453,750.00 | 0.52 |
| CADILAHC | 248,000.00 | 476,800.00 | 0.52 |
| ONGC | 4,661,250.00 | 8,981,250.00 | 0.52 |
| BHARATFIN | 31,000.00 | 60,000.00 | 0.52 |
| AMARAJABAT | 43,400.00 | 84,000.00 | 0.52 |
| JUBLFOOD | 304,500.00 | 590,000.00 | 0.52 |
| UNIONBANK | 2,226,000.00 | 4,392,000.00 | 0.51 |
| CEATLTD | 57,400.00 | 113,400.00 | 0.51 |
| TCS | 2,386,000.00 | 4,716,500.00 | 0.51 |
| M&MFIN | 270,000.00 | 535,000.00 | 0.50 |
| HDFCBANK | 1,640,000.00 | 3,259,000.00 | 0.50 |
| IOC | 3,861,000.00 | 7,713,000.00 | 0.50 |
| PCJEWELLER | 2,602,500.00 | 5,238,000.00 | 0.50 |
| DLF | 4,427,500.00 | 8,912,500.00 | 0.50 |
| SREINFRA | 1,064,000.00 | 2,149,000.00 | 0.50 |
| CANBK | 1,148,000.00 | 2,336,000.00 | 0.49 |
| NATIONALUM | 6,016,000.00 | 12,296,000.00 | 0.49 |
| GAIL | 1,125,474.00 | 2,301,621.00 | 0.49 |
| BAJAJFINSV | 39,250.00 | 80,500.00 | 0.49 |
| BATAINDIA | 299,200.00 | 621,500.00 | 0.48 |
| PEL | 104,190.00 | 216,836.00 | 0.48 |
| RELIANCE | 9,341,000.00 | 19,521,000.00 | 0.48 |
| IFCI | 3,000,000.00 | 6,325,000.00 | 0.47 |
| ICICIPRULI | 149,500.00 | 318,500.00 | 0.47 |
| TORNTPOWER | 111,000.00 | 237,000.00 | 0.47 |
| HDFC | 653,000.00 | 1,402,000.00 | 0.47 |
| SOUTHBANK | 4,938,009.00 | 10,638,261.00 | 0.46 |
| ASHOKLEY | 7,664,000.00 | 16,576,000.00 | 0.46 |
| INDUSINDBK | 343,500.00 | 756,000.00 | 0.45 |
| APOLLOTYRE | 1,371,000.00 | 3,039,000.00 | 0.45 |
| MARICO | 143,000.00 | 317,200.00 | 0.45 |
| ARVIND | 1,116,000.00 | 2,500,000.00 | 0.45 |
| UPL | 387,600.00 | 868,800.00 | 0.45 |
| TECHM | 849,600.00 | 1,905,600.00 | 0.45 |
| SUZLON | 10,215,000.00 | 22,950,000.00 | 0.45 |
| SUNPHARMA | 2,648,800.00 | 5,987,300.00 | 0.44 |
| INDIGO | 254,400.00 | 575,400.00 | 0.44 |
| LT | 2,101,500.00 | 4,814,250.00 | 0.44 |
| TATAPOWER | 2,169,000.00 | 4,995,000.00 | 0.43 |
| KTKBANK | 1,138,500.00 | 2,623,500.00 | 0.43 |
| ORIENTBANK | 294,000.00 | 684,000.00 | 0.43 |
| BAJAJ-AUTO | 255,250.00 | 594,250.00 | 0.43 |
| UJJIVAN | 230,400.00 | 544,000.00 | 0.42 |
| HINDPETRO | 3,435,075.00 | 8,178,975.00 | 0.42 |
| JINDALSTEL | 3,105,000.00 | 7,395,750.00 | 0.42 |
| TATAMOTORS | 12,708,000.00 | 30,355,500.00 | 0.42 |
| JISLJALEQS | 3,078,000.00 | 7,353,000.00 | 0.42 |
| ULTRACEMCO | 41,800.00 | 100,600.00 | 0.42 |
| GMRINFRA | 8,955,000.00 | 21,690,000.00 | 0.41 |
| L&TFH | 4,603,500.00 | 11,290,500.00 | 0.41 |
| IRB | 492,500.00 | 1,212,500.00 | 0.41 |
| HEXAWARE | 300,000.00 | 742,500.00 | 0.40 |
| INDIANB | 222,000.00 | 552,000.00 | 0.40 |
| BANKBARODA | 8,296,000.00 | 20,676,000.00 | 0.40 |
| RBLBANK | 304,800.00 | 811,200.00 | 0.38 |
| HINDZINC | 249,600.00 | 665,600.00 | 0.38 |
| HINDALCO | 5,008,500.00 | 13,569,500.00 | 0.37 |
| BHARTIARTL | 1,139,000.00 | 3,095,700.00 | 0.37 |
| ESCORTS | 465,300.00 | 1,267,200.00 | 0.37 |
| NHPC | 2,025,000.00 | 5,589,000.00 | 0.36 |
| ALBK | 528,000.00 | 1,474,000.00 | 0.36 |
| ITC | 6,592,800.00 | 18,436,800.00 | 0.36 |
| COLPAL | 15,400.00 | 43,400.00 | 0.35 |
| CESC | 126,500.00 | 357,500.00 | 0.35 |
| BPCL | 1,638,000.00 | 4,696,200.00 | 0.35 |
| INDIACEM | 2,194,500.00 | 6,300,000.00 | 0.35 |
| VEDL | 4,403,000.00 | 12,663,000.00 | 0.35 |
| MARUTI | 521,775.00 | 1,531,500.00 | 0.34 |
| MOTHERSUMI | 876,800.00 | 2,600,000.00 | 0.34 |
| APOLLOHOSP | 29,500.00 | 88,000.00 | 0.34 |
| POWERGRID | 872,000.00 | 2,616,000.00 | 0.33 |
| BEML | 51,000.00 | 160,500.00 | 0.32 |
| BEL | 2,316,600.00 | 7,345,800.00 | 0.32 |
| GRASIM | 250,500.00 | 798,000.00 | 0.31 |
| PFC | 2,820,000.00 | 9,006,000.00 | 0.31 |
| EICHERMOT | 21,525.00 | 69,675.00 | 0.31 |
| M&M | 1,189,000.00 | 3,856,000.00 | 0.31 |
| HCC | 918,000.00 | 3,006,000.00 | 0.31 |
| ACC | 109,200.00 | 358,000.00 | 0.31 |
| CASTROLIND | 190,400.00 | 627,200.00 | 0.30 |
| IDFCBANK | 4,587,000.00 | 15,158,000.00 | 0.30 |
| MCX | 41,300.00 | 138,600.00 | 0.30 |
| NCC | 2,528,000.00 | 8,552,000.00 | 0.30 |
| MANAPPURAM | 774,000.00 | 2,640,000.00 | 0.29 |
| ENGINERSIN | 336,000.00 | 1,162,000.00 | 0.29 |
| DABUR | 355,000.00 | 1,285,000.00 | 0.28 |
| KAJARIACER | 7,000.00 | 26,000.00 | 0.27 |
| CENTURYTEX | 91,300.00 | 339,350.00 | 0.27 |
| WOCKPHARMA | 94,500.00 | 355,500.00 | 0.27 |
| BIOCON | 376,200.00 | 1,483,200.00 | 0.25 |
| NBCC | 732,000.00 | 3,030,000.00 | 0.24 |
| TATAELXSI | 268,800.00 | 1,172,000.00 | 0.23 |
| IDEA | 7,119,000.00 | 31,094,000.00 | 0.23 |
| SYNDIBANK | 495,000.00 | 2,268,000.00 | 0.22 |
| CGPOWER | 276,000.00 | 1,272,000.00 | 0.22 |
| DCBBANK | 63,000.00 | 292,500.00 | 0.22 |
| RCOM | 6,860,000.00 | 32,088,000.00 | 0.21 |
| MGL | 16,200.00 | 77,400.00 | 0.21 |
| JPASSOCIAT | 4,556,000.00 | 22,474,000.00 | 0.20 |
| INFIBEAM | 2,288,000.00 | 11,308,000.00 | 0.20 |
| GLENMARK | 60,000.00 | 302,000.00 | 0.20 |
| CANFINHOME | 108,750.00 | 633,750.00 | 0.17 |
| PTC | 88,000.00 | 608,000.00 | 0.14 |
| KPIT | 166,500.00 | 1,251,000.00 | 0.13 |
| STAR | 53,600.00 | 434,400.00 | 0.12 |
| UBL | 11,200.00 | 115,500.00 | 0.10 |
| GRANULES | 80,000.00 | 975,000.00 | 0.08 |
| GSFC | 90,000.00 | 1,458,000.00 | 0.06 |
| CUMMINSIND | 2,100.00 | 60,200.00 | 0.03 |
| TATACOMM | 1,600.00 | 48,800.00 | 0.03 |
| CHENNPETRO | 1,500.00 | 109,500.00 | 0.01 |
In case, you are looking forward to trading in the share market or want a callback for more details, just fill in basic details here.
A callback will be arranged for you:
More on Share Market Education:
If you wish to learn more about the share market, here are a few references for you:
Summary
Reviewer
A Digital Blogger
Date
Broker Name
Put Call Ratio
Overall Rating
