


Looking for Low Brokerage, High Margin & Free Tips?
Best Intraday Trading Indicators
| | Intraday Trading | 3 Comments
More on Intraday Trading
Looking for the best intraday trading indicators? Well, there are very few that actually solve the purpose. A lot of trading indicators end up confusing the trader and sometimes, ruining the trade as well.
Thus, you need to be very cautious on what intraday charts, intraday trading strategies you are using so that those can be employed on appropriate trading indicators.
All these decisions are super crucial while you are into Intraday trading.
Anyway, let’s not jump the gun.
The best tip that is given to any intraday trader is to always follow the trend.
Be it a beginner or an established trader, the most important trick they have to learn is to predict the movement of the prices of the securities that they are trading in.
It is critical for an intraday trader to understand the market and where it is going or expected to go.
This is done by using technical analysis.
Technical analysis is a trading mechanism that is used to analyse the statistics from the price movements and the volumes to predict the further trend of the securities.

Trading softwares makes use of the intraday trading indicators to make predictions of stock market.
Intraday trading indicators are the tools that are used in combination with the trading strategies to give maximum returns to the traders.
Some traders use many indicators, while others use none, however, it is advisable to use the most appropriate and best Intraday Trading Indicators to help to make the correct call.
Trading indicators provide valuable information regarding the direction of the market trend, momentum of the market, popularity of the securities through volume assessment, and the potential of profit by trading in that security.
These Intraday Trading Indicators give the trader a clearer view of the market and help them in making better-informed decisions with respect to which securities they should trade-in and how.
There are multiple intraday trading indicators available and each serves a different purpose in terms of the time frame of the trend, or whether they are indicating trend or momentum.
So, it becomes a crucial decision for the trader to decide on which trading indicators does he choose to use.
The indicators must be chosen in tandem with the overall trading strategy and also after understanding fully how that indicator works, what calculations it makes and how will those calculations impact the trader’s trading decisions.
10 Best Intraday Trading Indicators
The 10 best intraday trading indicators which are used, either singly or in conjunction with the other indicators, are as follows:
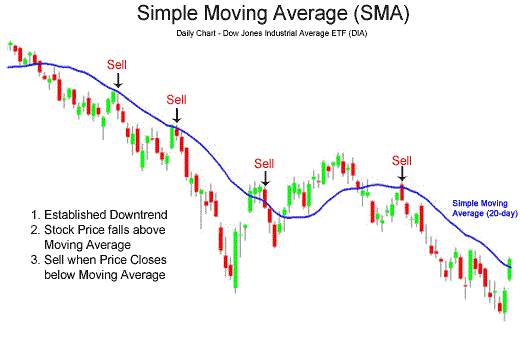
1. Moving Averages
It is one of the most commonly used Intraday Trading Indicators. Moving averages is simply a line plotted to join the average closing price of a security over a specified period of time, like 100 days moving average to understand the exact direction.
It is also considered one of the Best Indicators for Day Trading Futures because it helps you to catch the price of a stock that you want to trace.
The longer the duration, the more accurate and reliable the moving average.
It helps the traders to find out the trading opportunities in the direction of the current trend and smoothens out the volatility of the market to give a clear picture.
It gives information about the momentum of the market, which is an important characteristic for intraday traders, the trends, reversal of trends, and stop loss and trailing stop loss points.
One of the most commonly used moving average trading indicators is Kaufman Adaptive Moving Average Indicator.
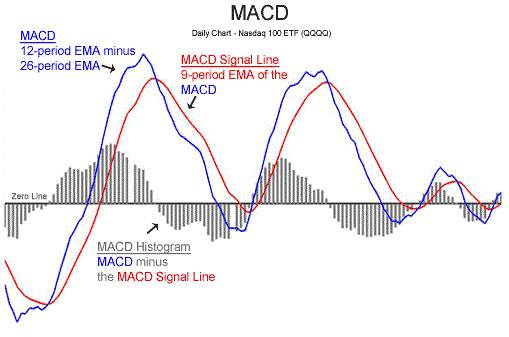
2. Moving Average Convergence Divergence (MACD):
MACD is one of the most reliable and best Intraday Trading Indicators, especially for momentum traders. It gives information about momentum, trend direction and duration.
As explained by the name itself, MACD works on the convergence and divergence of two moving averages.
The difference between two moving averages, normally called MACD spread, is calculated by subtracting 26-day EMA (exponential moving average) from 12-day EMA.
This difference helps to plot the MACD line. A positive value of the MACD spread indicates an upward trend and a negative value indicates a downward trend, and the value indicates the strength of the trend.
A signal line is also plotted using a 9-day EMA.
When the MACD line moves above the signal line, a buy signal is generated and when the MACD line is below the signal line, a sell signal is generated.
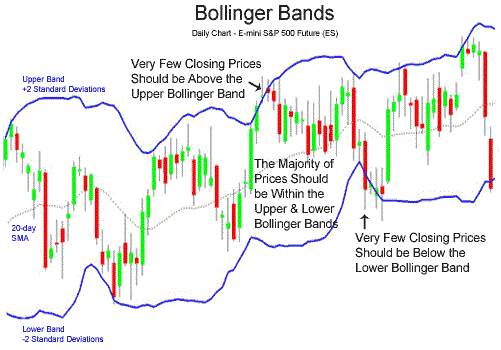
3. Bollinger Bands
Bollinger Bands or BB is one of the most useful trading indicators. BB helps to determine the overbought and oversold levels.
It consists of three bands: a middle band which is the 20 day SMA, an upper band which is +2 standard deviation, and a lower band which is -2 standard deviation.
The price of a security moves between the upper and the lower bands normally. When the volatility is more the bands widen and when the volatility is less the gap between the bands’ decreases.
Intraday Technical analysis using Bollinger Bands gives almost 80% success. The strategy used is that when the price is closer to the upper band, the security is expensive and will try to come back to its average, so the security can be sold at the upper band price with a target of the middle band price or the 20-day SMA.
This indicator is seen as one of the best indicators for positional trading as well. Thus, if you are into that format of trading, it’s a good idea to go with this indicator.
Similarly, when the price of the security is close to the lower band, the security is cheap and will try to move up to its average; the security should be bought at the lower band price, with the target as the middle band price.
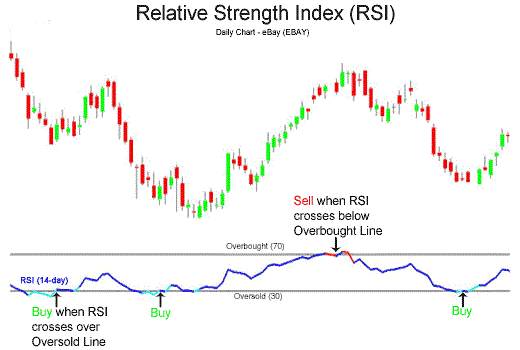
4. Relative Strength Index (RSI):
RSI is the trading indicator that follows the concept of buy low and sell high. It is a simple and useful trading indicator that tells when the security is overbought or oversold and may undergo a reversal.
RSI can be set for different time frames and can hold values between 0 and 100; wherein zero indicates oversold and hundred indicates overbought.
Any values in between indicate the expected trend. If the RSI value is less than 30, the stock is expected to go up and if the RSI value is more than 70, the stock is expected to go down.
RSI is an excellent momentum indicator and if the price of the security reaches the 30 or 70 levels, the trader can be alerted to set up a trade in the same direction as the break.
With all these intricacies covered, RSI is easily one of the best intraday trading indicators for your usage.
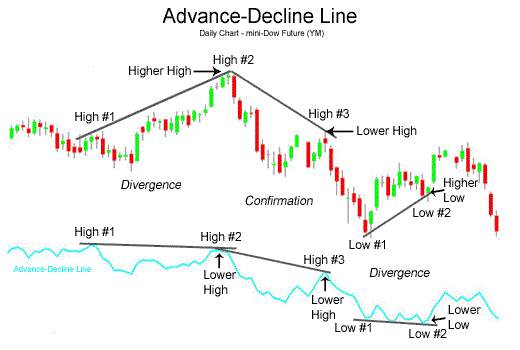
5. Advance-Decline Line:
The Advance-Decline line (AD line) is one of the breadth indicators. It does the analysis based on the market sentiments and calculates Net Advances, which is the difference between the number of advancing stocks and the number of declining stocks.
So, Net Advances is positive when advances are more than declines and vice versa. The AD line is plotted and then any bullish or bearish divergences are observed on.
A divergence shows the change in participation and may predict a trend reversal.
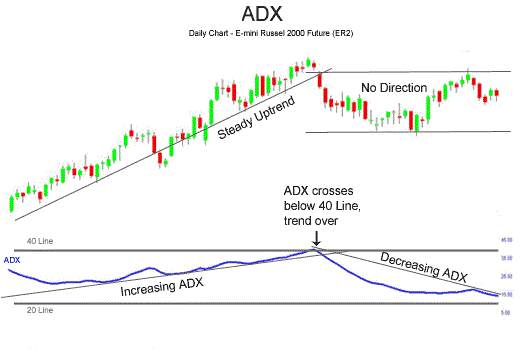
6. Average Directional Index (ADX):
ADX is one of the Intraday Trading Indicators that gives information not just about the trend, but also about the strength of the trend.
It is of critical importance because once the strength of the trend is known, trading in the direction of a strong trade will ensure that the trader has reduced his risks and increased his profit potential.
ADX makes use of plus directional indicator (+DI) and minus directional indicator (-DI), which are the smoothed averages, and the difference between the two is used to derive the average directional index.
ADX takes values between 0 and 100 and indicates the strength of the trend.
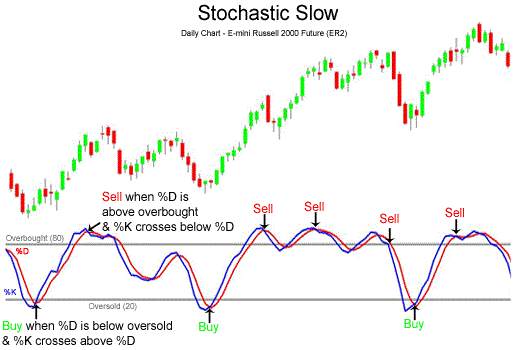
7. Stochastic Oscillator:
The stochastic Oscillator is one of the momentum trading indicators and certainly one of the best in the herd. It compares the closing price of a security to a range of prices over a specified period of time.
Stochastic Oscillator does not follow price or volume, instead, it follows the momentum, which serves as a useful indicator as the momentum changes direction before price does.
It is also a range-bound indicator, so it is also used to give information about the overbought and oversold securities.
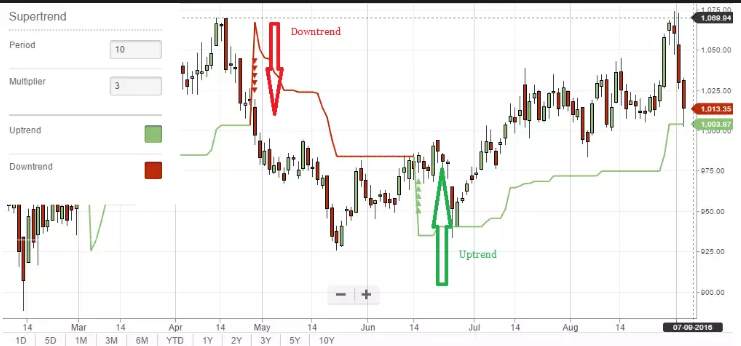
8. SuperTrend:
SuperTrend is an excellent and one of the best intraday trading indicators which give clear buy or sell signals in a trending market. It follows the prices, like the moving averages, and the placement of the line shows the current trend.
It is made up of two parameters: period and multiplier, and uses average true range (ATR), which is the degree of price volatility, for the calculation of its value.
So, the period is the ATR number of days and the multiplier is the value by which ATR is multiplied.
A buy signal is generated when the SuperTrend closes above the closing price and a sell signal is generated when it closes below the closing price.
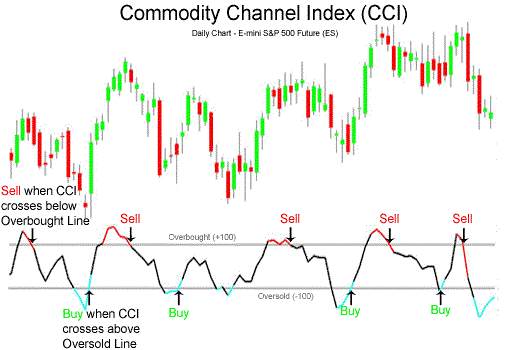
9. Commodity Channel Index:
CCI is one of the most useful Intraday Trading Indicators in the commodities market, however, it can also be used in the stock market. It helps to identify new trends and gives warning about extreme conditions.
It actually measures the difference between a security’s price change and its average price change and has values of 0, +100 and -100.
If the value of CCI is positive, it indicates an uptrend, and when the CCI value is negative the stock is in the downtrend. CCI is commonly used in conjunction with RSI to get information on overbought and oversold conditions.
CCI can be calculated for different time frames and in a shorter period CCI is more volatile.
You can read this in Hindi as well.
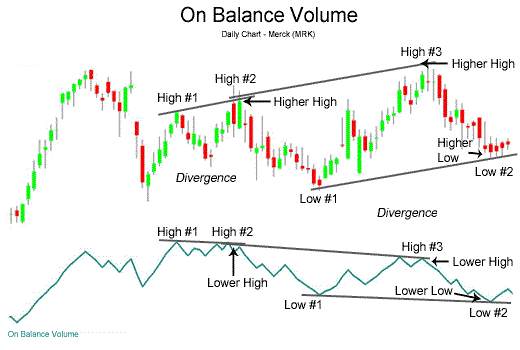
10. On-Balance Volume:
OBV is also one of the momentum Intraday Trading Indicators.
It makes use of the volume flow to predict the changes in the price of the security. OBV adds up the volumes on up days and subtracts the volume on down days to measure the buying and selling pressure.
If the closing price is above the prior closing price then current OBV is the sum of previous OBV and current volume, and if the closing price is below the prior closing price then current OBV is the difference between previous OBV and current volume, and if the closing price is the same as the previous closing price then current OBV is the same as previous OBV.
Thus, there are various technical Intraday Trading Indicators available but what the trader derives from each one of them and their combination depends upon the judgment of the trader.
It is advisable to use only one or two technical indicators at a time to avoid intraday trading mistakes as more information can make decision-making more complex and inaccurate.
In case you are looking to start trading online, feel free to share some basic details below.
We will arrange a quick callback for you:
More on Share Market Education:
Summary
Reviewer
A Digital Blogger
Date
Broker Name
Intraday Trading Indicators
Overall Rating

3 Comments
Very soon thiѕ web site will bᥱ famous among alⅼ blog սsers, ⅾue
tߋ іt’s fastidious articles օr reviews
right.i like ur comment
Looking good. Useful for traders…