


Looking for Low Brokerage, High Margin & Free Tips?
Technical Analysis Apps
More on Share Market Analysis
These days people are very smart, they don’t just use mobile apps only for movie ticket booking, listening to music, watching videos etc. but they also for getting proper knowledge in their area of profession and education. Most of the investors also use android mobile for technical analysis apps for their stock market trading.
Isn’t that a smart move?
Some traders even stay confused does technical analysis work at all?
Well, such technical analysis apps can be really handy for you if you are looking to pick stocks for your trades. Furthermore, these apps, with their exhaustive feature base, can help you to save time and make actionable moves at the right time.
Let’s find some of the best technical analysis apps available for you out there:
Best 5 Technical Analysis Apps in India
Now-a-day many apps are available for technical analysis of stocks, which can help you to get information related to the share market research and analysis. Android play store is the largest and most popular app store which provides many apps related to technical analysis.
But, it’s a big problem to select the ones which are beneficial as there are various apps are available for different fields of research.
In this detailed review, let’s talk about 5 Technical Analysis apps for the Android play store that you can download and install for your share market research and analysis:
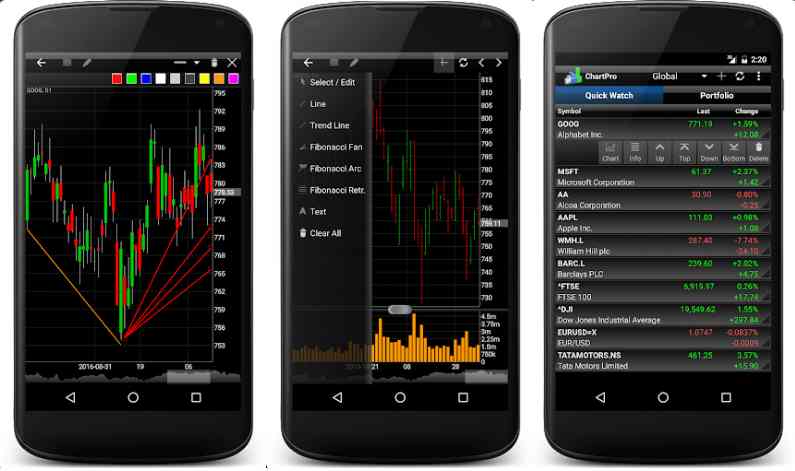
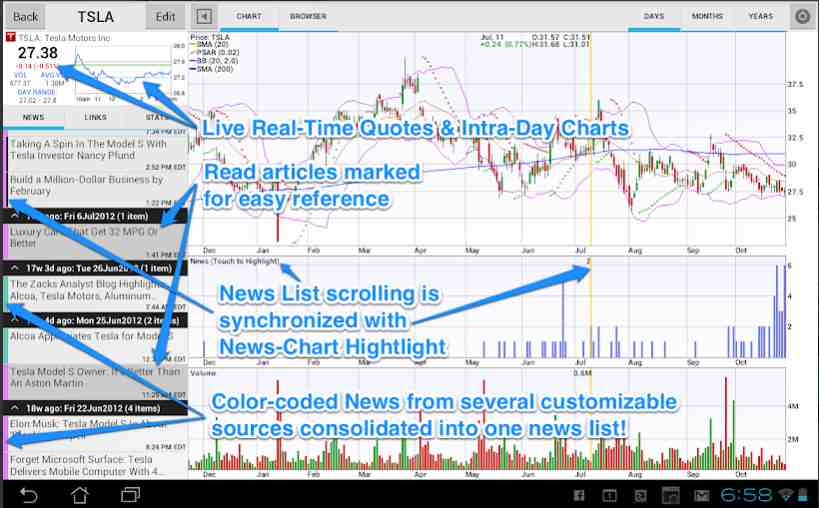
1. Professional Stock Chart
This is one of the best technical analysis apps. It is used for different types and sectors of stock tracking and intraday technical analysis.
The application has a wide range of charts that help you in taking the decision for stock investment.
Following are some of the features of the Professional stock chart app:
- Approx 50 technical indicators (MACD, moving average envelopes, RSI, Parabolic SAR, Stochastic Oscillator, % R etc)
- Scrollable historical stock data
- Share Market News
- Crosshair cursor
- Pinch to zoom
- Area, Line, Candlestick chart type
- Chart themes
- Offline mode available for users with limited internet bandwidth
- Drawing tools
This is how the app looks like:
The application is also useful for managing a stock portfolio. It contains information related to stock investment. It supports adding new transactions, managing existing transactions, dividends etc. You will also get the value of your stocks on a real-time basis.
Features of the stock portfolio are:
- Opening both short and long positions
- Opening stock charts daily from the stock portfolio
- Stock details like 52-week high and 52-week low
- Adding dividends
- Managing splits
- Sorting of symbols
- Adding and removing of transactions etc.
As this application is full of stock charts, it is suitable for technical analysis. If you want to do a technical analysis of a stock you are looking to invest in, this application will help you a lot in that aspect.
The application has also support for currencies. Some most of the popular markets are supported on this application like the US market, UK, Canada, Germany, Australia, India etc.
Also Read: Best Commodity Trading Apps
At the same time, some of the problems related to this technical analysis mobile app that you must be aware of are:
- App crash issues reported, although in limited numbers.
- The real-time market updates can be relatively slower in this app
Here are the stats of this Technical Analysis App from the Google Play Store:
| Number of Installs | 100,000+ |
| Mobile App Size | 5.5 MB |
| Negative Ratings Percentage | 5.6% |
| Overall Review |  |
| Update Frequency | 3 weeks |
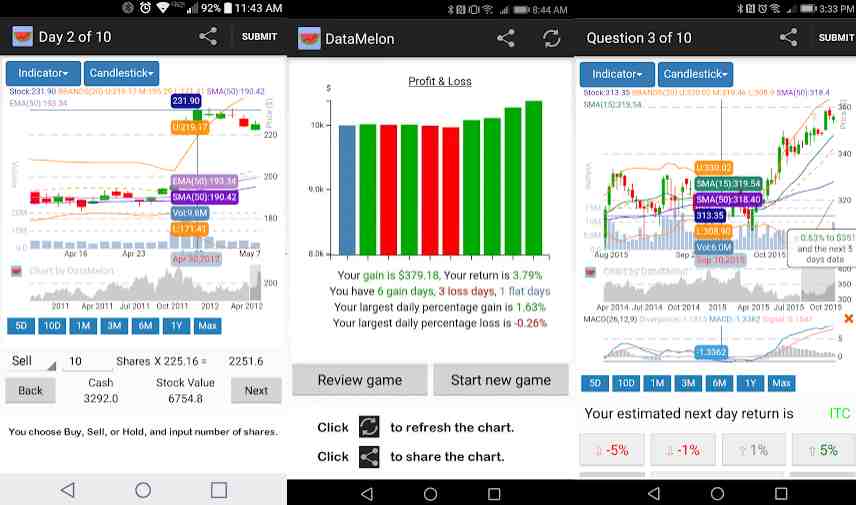
2. DataMelon
DataMelon is easy to use and a free Technical Analysis Apps for stock technical analysis, simulation and quizzes. This app is popular among investors because of its multi-functions. T
his technical analysis app covers more than 5700 stocks of NYSE, NASDAQ, AMEX and ARCA.
Here, you can test your knowledge of the stock market and analysis and get a score from each test. In this way, you can judge yourself by seeing progress in your score. You can also see whether your stock market prediction and analysis are right or wrong after getting a score from each test.
Quizzes are also available related to the stock market.
Except for quizzes and tests, this is a good technical analysis app. Also. It gives you interactive, fast and reliable stock charts which are shareable for technical analysis.
Here is how the DataMelon App looks like:
Some of the favorite features of this technical analysis app are
- More than 5700 stocks from all big markets like NASDAQ, NYSE, AMEX etc are tracked and updated every day before or at 5.00 PM ET.
- Technical analysis tools and interactive stocks charts are available on this technical analysis app. Technical indicators which available are simple moving average (SMA), Moving average convergence divergence (MACD), Average directional index (ADI), Exponential moving average (EMA), Accumulation distribution line (ADL), Know sure thing (KST), Aroon indicator, Money flow index (MFI), Negative volume index (NVI), Accumulation distribution line (ADI).
- Stock charts can be shared with other apps like Facebook, Twitter, Email, WhatsApp, Instagram etc.
- Gives the opportunity to practice real-life daily trading from historical data.
- Up to 16 main technical analysis tools and techniques can be reviewed in one page.
- Can easily compare different stocks.
- Can be used offline.
Some of the problems reported by the app users are as follows:
- The app is relatively new and thus, the number of features is less.
- The design of the app can be made a little more soothing, can be cumbersome for beginner-level traders.
Here is how DataMelon technical analysis app is placed at the Google Play Store:
| Number of Installs | 1,000+ |
| Mobile App Size | 5.5 MB |
| Negative Ratings Percentage | 5.6% |
| Overall Review | |
| Update Frequency | 3 weeks |
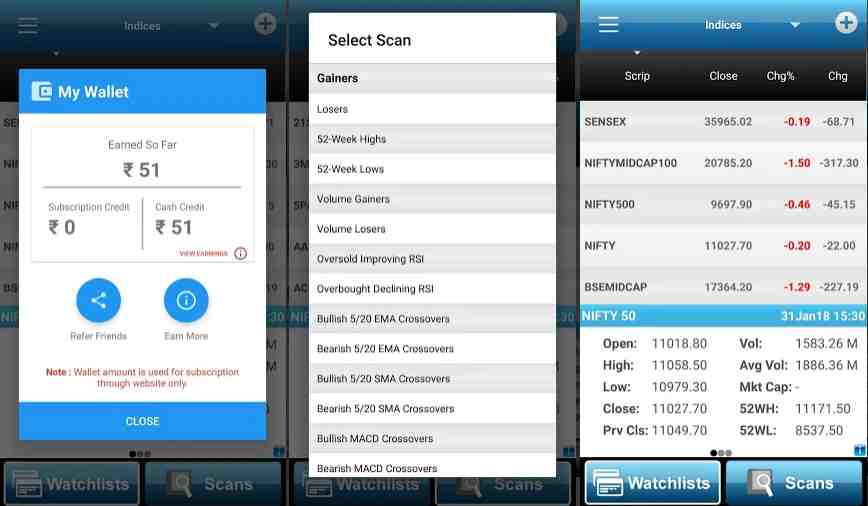
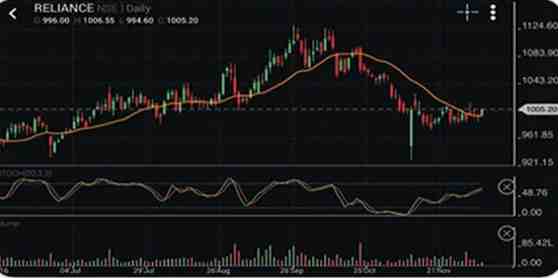
3. Investar:
This is another one of the top-class technical analysis apps for investors. This app. Is downloaded by many users who want to be updated to the stock market. It is a great app. for technical analysis on your android phone. It helps to get any chart for analysis at any time.
This is how the Investar app looks like:
Features of Investar:
- Such technical analysis apps provide interactive charts to the user with a zoom feature.
- Live chart update of the candlesticks, depending on the subscription that how much time delayed you will get live data on the stock market.
- Unlimited watchlist- According to your preference you can add as many stocks in your watchlist. This app. Do not give any restriction on the number of watchlists. The main benefit of the feature is that you can take advantage of a comparison of many stocks at a time.
- Almost all technical indicators are available on this app such as Accumulation distribution line (ADL), Know sure thing (KST), Aroon indicator, simple moving average (SMA), Moving average convergence divergence (MACD), Accumulation distribution line (ADI), Negative volume index (NVI) etc.
- Push notifications
- Resistance and support level based on a pivot- point.
This app has got a four-star rating out of five. And it has more than 1,00,000 users who have downloaded this app for getting help in technical analysis.
Here are a few issues reported by the users of this technical analysis app:
- Few features such as overlays missing for advanced level stock market analysis
- Relatively fewer features are available in the free version of the app.
Here are the complete details on the stats from the Google Play Store:
| Number of Installs | 100,000+ |
| Mobile App Size | 6 MB |
| Negative Ratings Percentage | 16.2% |
| Overall Review |  |
| Update Frequency | 3 Months |
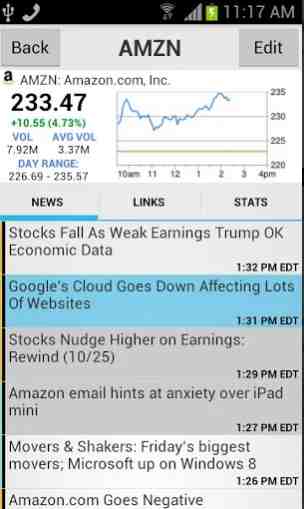
4. Stock Spy
This technical analysis app is one of the famous apps used by investors in the stock market. This app helps in tracking your stock portfolio, real-time quotes, Charts, news etc from around the world stock market.
Stock Spy is a very important research tool, which gives charts and tools of technical analysis also to the investors.
This is how the Stock Spy app looks like:
There are a lot of useful features of this app, some of them are:
- Many technical analysis charts are available like RSI, simple moving average, candlestick charts, EMA, Bollinger Bands, Parabolic SAR.
- Real-time volume and quotes of stocks are available from different exchanges of the world like NASDAQ, NYSE, Germany, London, Italy, AMEX etc.
- Quote shows different darker background color in green or red, if any stock changes more than (plus or minus) 2%.
- Almost all important ratios like P/E ratio, book value, EPS, PEG, Price/sales etc.
- Real-time intraday charts- In the form of a stock list and & symbol details.
- Price history of stock – 52-week range and % change.
- Dividends per share: per share yield, pay date, ex-dividend.
- If any time your device is lost or damaged, you can easily access your stock data into other devices by login into your account.
You must know some of the related concerns with these technical analysis apps:
- Google ads can be annoying at times for a decent user experience
- Although a rare sort of an issue, there are charting loading concerns observed.
As far as the user feedback from the Google Play Store is concerned, this is how it stands:
| Number of Installs | 1,000,000+ |
| Mobile App Size | 18 MB |
| Negative Ratings Percentage | 4% |
| Overall Review | |
| Update Frequency | 3 Weeks |
Edelweiss Mobile Trader:
It is one of the relatively new Android Technical Analysis Apps that are super speedy in equity and commodity trading. It helps you track and trade across stocks, equity derivatives, currency derivatives, bonds, e-SIP, bonds etc. across MCX, NSE, BSE and NCDEX.
This is not a technical analysis app as such but a stock market trading app that provides a provision for technical as well as fundamental analysis of stocks.
This mobile app is free and assists you with its advanced technology in tracking and tracking of stocks live. This is how the mobile app from Edelweiss looks like:
This app is optimal for you if you like to do trade in quick steps and live. It is one of the better apps for the Indian stock market and it will help you to get technical charts of stock, live news, Customizable market watch and many more.
Features of Edelweiss app
- Live streaming feeds across MCX, NCDEX, NSE and BSE.
- Watchlist customization feature, 50 stocks can be in watchlist at a time.
- Preset market watch for SENSEX, bank nifty, nifty 50, nifty IT etc.
- Recommendations for stocks to buy sell or hold on a long-term and short-term basis.
- Updated calendar to track events of corporate-like dividend, management, stock splits, any new projects etc.
- You can also search for your favorite stock and details of market depth related to the stock.
- News with sentiment analysis.
At the same time, here are some of the concerns raised by the users of this technical analysis app:
- Average user experience with pop-ups, especially for non-account holders with the stockbroker.
- Speed can be improved.
Here is a quick look at the stats of this mobile app from Google Play Store:
| Number of Installs | 500,000+ |
| Mobile App Size | 23 MB |
| Negative Ratings Percentage | 7.8% |
| Overall Review | |
| Update Frequency | 5 Weeks |
Technical Analysis Apps Summary
Before we wrap up this detailed review on the technical analysis apps, here is a quick summary for your reference about the top technical analysis apps you can use in your trades:
- Professional stock chart– This application is helpful in getting many charts related to your stock for technical analysis.
- Datamelon– This app is also one of the most popular technical analysis app, which gives you many advantages over the phone at any time and anywhere. Many technical analysis tools are also available. It helps in the comparison of different stocks and can be used offline also.
- Investar– This is another app for technical analysis, which can be used by many investors. It provides interactive charts with zoom features.
- Stock spy: This app is not a special app for technical analysis but helps in a better way in getting charts for technical analysis.
- Edelweiss mobile trader: The last one is for stock market research and analysis with technical analysis charts and data and is also one of the best intraday trading apps as well.
So, if you are a beginner and want to understand the basics of how to do technical analysis of stocks, then these are the apps that would makes your journey easier
In case you are looking to get started with Share Market Trading or you are looking for one of the best Technical Analysis Apps, you can just fill in some basic details in the form below.
A callback will be arranged for you:
More on Share Market Education:
If you wish to learn more about the share market, here are a few references for you:
Summary
Reviewer
A Digital Blogger
Date
Broker Name
Technical Analysis Apps
Overall Rating

One Comment
TrendSpider just announced dynamic chart monitoring which enables traders to set up a trade scheme and have the software automatically track any indicator or trendline automatically, which not only saves time and frees you up to do other things but helps you time your trades better.