


Looking for Low Brokerage, High Margin & Free Tips?
Head and Shoulders Pattern
| | Chart Patterns | 1 Comment
More Chart Patterns
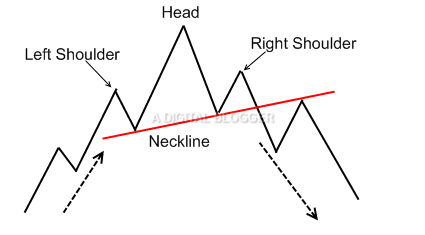
Head and shoulders pattern, as the name of this chart pattern suggests, is shaped like a head with two shoulders on either side. A regular pattern is a form of stock market prediction for a trend reversal from bullish to bearish. It may be either a reversal pattern or a continuous pattern.
The trend which precedes the head and shoulders pattern determines whether it will be a reversal or a continuation of the former trend.
Head and Shoulders Pattern Indicator
You would find a left shoulder followed by a head that is further followed by a left shoulder in a typical head and shoulder pattern. The left shoulder is formed when a price increase is experienced going towards the activity of the bulls.
The downward slope of the left shoulder depicts how prices gradually fall.
The subtle rise and fall of prices are followed by a more profound effort of the bulls towards a more surpassing upward trend in the prices. However, the bullish force does not last for long, another result, prices start retreating along the downward slope of the head.
The final trend pattern for the head and shoulder depiction is the right shoulder, which is a third attempt by the bulls to put the prices higher. However, in this case, the bulls fail to achieve a price peak as high as the one achieved in the preceding head pattern.
Finally, the bearish force appears to prevail in the market space, as the bulls are restrained achieving a higher or even an equal price speak.
As the prices fall back, the market is in a fluid state, indecisive about whether the bulls will gain power.
After the right shoulder is formed, we reach the neckline of the trend, which forms the starting point for a series in the opposite direction. This is a typical bearish form of the head and shoulder pattern which appears subsequent to an uptrend.
When the head and shoulder pattern is reversed, a bottom reversal pattern occurs, also known as the inverse head and shoulder pattern. In rare cases, market dynamics may give rise to multiple shoulders on the left or right, as opposed to a single left or right shoulder.
This leads to setting up a relatively complex head and shoulders pattern.
Head and Shoulders Pattern Neckline
The top reversal head and shoulders pattern performs well in a bull market.
Also Read : Bull Market Meaning, in detail and clear your confusion.
When one draws a line through the troughs is known as its neckline.
Three types of necklines may be evident in head and shoulder patterns. The neckline can have either upward flow, download slow, or no slope at all. When the second trough exceeds the first trough in height, an upward sloping neckline result. A downward sloping neckline occurs when the converse is true and the second trough is lower as compared to the first trough.
A horizontal neckline is least common and is visible when the prices of both troughs are even.
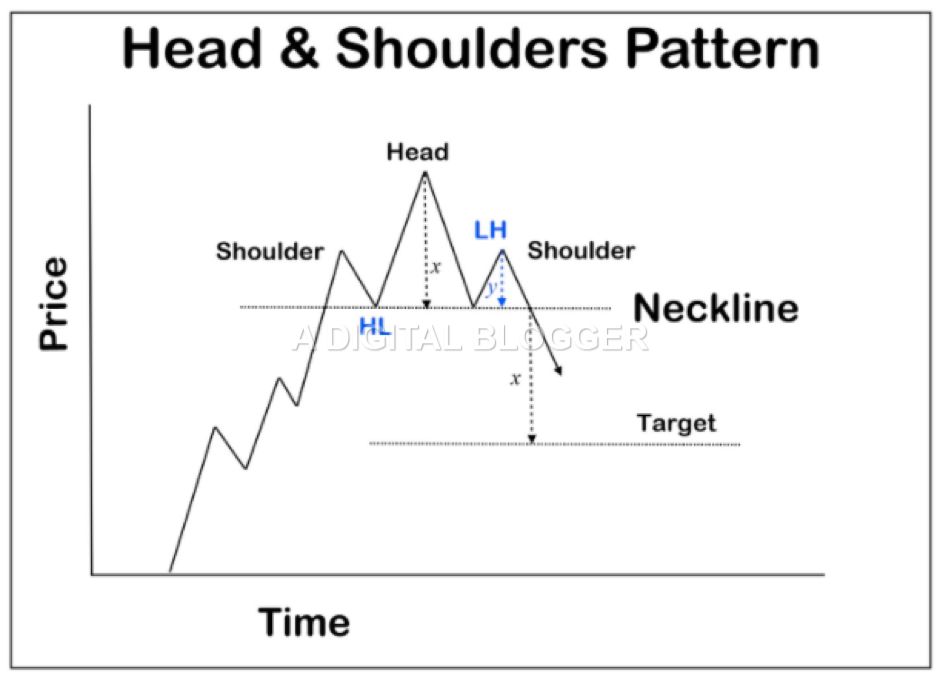
Head and Shoulders Pattern Target
Most traders use the head and shoulders pattern measurement price target for the complete pattern. The estimated distance for the immediate price is available by traversing along the trend line after the point where the neckline is broken.
From this point onward, one has to go back and measure the vertical distance from the peak of the pattern head up to the neckline. Thereafter, the distance can be subtracted from the neckline at the point where the price is indicated after the completion of the full pattern.
This estimate helps to understand the extent to which prices may decline when the top formation is completed.
Price target may be identified using the head and shoulders top pattern as well as the bottom pattern. To find the price target using the top pattern, the distance from the head to the neckline is measured to find out the spread amount. Later, the breakout point can be ascertained at the junction of the neckline on the right shoulder.
The distance previously measured from the head to the neckline is used to determine a downside price target level. To find the price target for the head and shoulders bottom, the distance from the head up to the neckline is first measured. Subsequently, the breakout point is estimated at the junction of the right shoulder and the neckline.
After this, the distance measured previously is again used to find out the upside price target level.
Prices that break into the neckline precisely dissipate the sell signal. However, the anticipation of the neckline does not suggest taking up trade owing to the risk of failure. A price target as high as the pattern is generally ideal for trading.
The height of the pattern refers to the difference between the high price of the highest peak and the lowest price of the two troughs. This difference must be subtracted from the breakout price.
Analysts suggest that an ideal head and shoulders Breakout download price could be calculated using the following formula:
Head and shoulders Breakout Downward Price Target =
Breakout price – ((high price of head speak – the price of the two troughs or neckline price) X 55%)
The plausibility of the Head and shoulder pattern is guaranteed when certain features are characteristic to the pattern. A greater magnitude of price reversal is expected when the price increase preceding the pattern is larger.
The size of the price reversal increases when prices increase faster prior to the pattern. Stock traders may look for a higher left shoulder when compared to the right to ensure better performance of the securities. Lastly, upward sloping lines are an indication of good performance.
Head and Shoulders Pattern Price Example
Let’s take a quick example to understand this concept of Head and shoulders pattern in real-life trading.
For example, let’s say the opening market price of SBI is 288.30.
The bulls jump in with positive market news of strong quarterly results and take the stock price t0 305.30. Wow!
But then, bears pool-in via institutional investors and take the stock back to around 290.4.
Suddenly, by around 1 pm, a prominent investor of the country sees an opportunity and buys a huge chunk of SBI stocks. Seeing an increased push in the volume, other retail investors follow the buying pattern and take the stock price to 302.1.
This buying pattern continues for a while till around 2 pm when the stock price is at 308.5 and then suddenly, the market sees stocks being dumped, thereby, taking the stock back to around 295.2.
This goes on as a tug of war between the bulls and bears. The price push finally ends at the end of the day with the SBI stock closing at 290.60.
This is what happens in a Heat and shoulders pattern. Bears win at the end!
Head and Shoulders Pattern Price Rules
If you are looking to make money while using this pattern, you just need to take care of a few basic rules, always!
Here are those listed:
- Remember, in order to use this pattern, the market trend must be bullish i.e. there must be an uptrend.
- Only enter when the stock price has breached below the neckline (explained above).
- Position your stop-loss at a price point above the right shoulder of the pattern.
- Find out the difference between the head i.e. the peak price and the neckline. Let’s call is HSD.
- Now deduct this HSD from the neckline price and the new price point is your target price for the limit order
That’s it!
Place your trade and you are good to go and make profits using the head and shoulders pattern.
Inverse Head and Shoulders Pattern
The inverse head and shoulder pattern is a bullish form and appears after a downtrend. It is the exact opposite version of the regular head and shoulder pattern. The reverse head and shoulders pattern also has the left shoulder, head, and right shoulder. When prices are pushed downwards by the bears, new lows are visible in the trend.
But prices may return back to the neckline when bulls start pushing them towards this direction.
Bears continue to compete and push prices to a point even lower than the previous low. After this where is bearish action, more buyers come into the picture in response to the newly lowered prices. As a last move by the bears, prices are plunged down even further, but they are unable to create a lower low.
Their unsuccessful attempt is a bullish sign, indicating the market dominance since the bears were unable to push prices down beyond the preceding low.
This time, prices reach the confirmation line once again, and a scenario results, where either the bulls or the bears may succeed to regain market force. At this point, it may so happen, that the bears may push prices down, as they did before, or the bulls main push prices up to assert their market force.
How to Carry Out Head and Shoulders Pattern Trading?
Similar to the characteristics of other candlestick patterns, the price is an important variable which shows when a trend is about to reverse. Sometimes, prices indicate a reversal, and at other times, they indicate the initiation of prices. In this context, the head and shoulders pattern illustrates the transition from a downward trending price line to an uptrend.
This pattern is prevalent in all markets and occurs irrespective of time frames.
The best way to trade with the head and shoulders pattern is to look for the completion of the formation, as this confirms that the head and shoulders pattern is valid. Starting to trade after such information could prove profitable.
However, fake patterns may appear at times and the best strategy is to set up a stop-loss order. In the reverse head and shoulders pattern, the closing of prices about the confirmation line is a signal to watch out for. An upward sloping confirmation line is a more powerful form of a signal as it indicates flat prices are achieving higher highs.
Learning to trade with the head and shoulders pattern can become considerably simpler through the use of volume analysis. To incorporate volume, you must find out the nature of the confirmation line.
When the confirmation line tends to incline towards the downside, you must look for a large amount of volume.
Sometimes, a sharp increase in volume is accompanied by a gap down which is the potential sell signal after the piercing of the confirmation line. In the case of the reverse head and shoulders pattern, a break that occurs in the confirmation line must be accompanied by a volume increase.
Therefore, the head and shoulder pattern is a very important reversal pattern for stock traders. The head and shoulders pattern is a unique and conspicuous pattern in stock trading. At the same time, the pattern is evident only after a specific series of interactions in the form of price competition between bears and bulls.
The head and shoulder pattern is a typical manifestation of multiple attempts to push prices either higher or lower depending on whether it is a regular pattern or an inverse one.
With this being said, we would like to wrap up this piece on the head and shoulders pattern. Hopefully, after reading this, you were able to add something to your trading armoury today.
In case you are thinking of getting started with stock market investments or trading, let us assist you in taking the next steps forward:
More on Share Market Education
In case you are looking to learn more about Chart Patterns, here are some reference articles for you:
Summary
Reviewer
A Digital Blogger
Date
Broker Name
Head and Shoulders Pattern
Overall Rating

One Comment
Good