


Looking for Low Brokerage, High Margin & Free Tips?
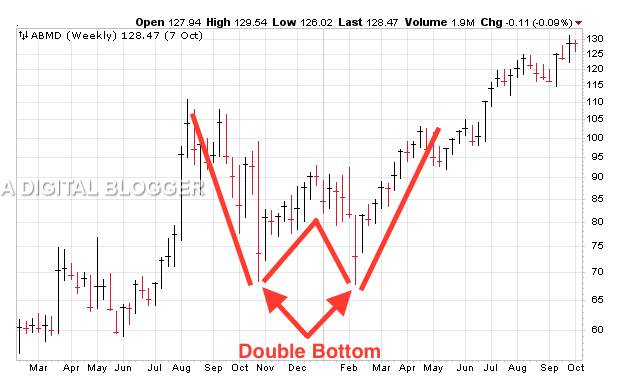
Double Bottom Pattern
| | Chart Patterns | No Comments
More Chart Patterns
A Double bottom pattern is a bear market scenario and is the most frequent sell signal. A double bottom pattern signifies the reversal trend in the form of falling stock prices, which is followed by a retracing of prices to their former levels.
The final action in a double bottom pattern is another similar price drop and rebound.
The double bottom pattern is complete when a ‘W’ is spotted on the candlestick chart. In double bottom patterns, it is important to understand that the patterns work best when observed over longer time periods as opposed to short time frames.
It is also possible that many patterns may form and disintegrate over time. The reversal confirmation occurs only when the key resistance breaks down.
Double Bottom Pattern Meaning
The lows of a double bottom pattern form at the same level of prices. You can trade with a double bottom pattern with a high level of reliability. However, as a stock trader, you may observe a considerable variance in terms of timing.
Charts may depict a range of intervals in the form of daily or intra-day charts, weekly, monthly, yearly, or long-term periods. The double bottom chart pattern is a bullish reversal pattern with two successive tests for a key price level on a candlestick chart.
The pattern starts taking shape towards the end of a sustained downtrend, which was apparent for weeks or even months.
Double Bottom Pattern Formation
This pattern is exactly in the opposite direction of the Double Top Pattern.
Analysts believe that the first bottom is sharp and the second bottom is often rounded. This occurs as a result of sharp selling activity as the first pattern forms, followed by a more sustained selling process, leading to the rounded bottom towards the end of the pattern formation.
As prices rise above the highest high, the pattern is perceived as complete. This depicts its confirmation point.
Needless to say, in terms of trading volume, the left bottom scores better than the right bottom in a double bottom pattern. An activity of maximum volume is reached when the pattern encounters its first low.
Thereafter, the trading volume decreases as the second low is created.
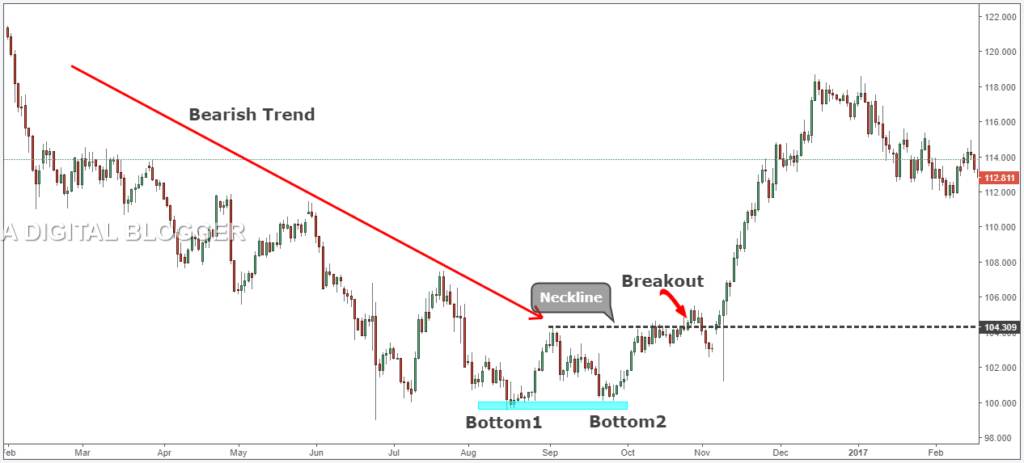
This low-volume sign does not last long, as an increase in volume is experienced after the pattern is complete. Buying power increases significantly and stock prices are pushed beyond the confirmation point and rise consistently. This is the point where the neckline is broken.
Bears can start their buying activity when they observe that a breakout has occurred.
Double Bottom Pattern Technical Analysis
In simple words, the double bottom pattern is the depiction of a long-term trend, which starts after a prior trend or an existing trend with the potential to reverse. This may be a downtrend spanning several months in a row.
There is a very strategic manner in which you can carry on your technical analysis on a double bottom pattern.
The first trough forms to mark the lowest point in the current trend. Thereafter, advancement in the form of a peak takes place to the extent of 10% to 20%, and a decline towards the second trough is spotted.
When buying pressure accelerates and volume builds up, a change in the sentiment is experienced towards the initial resistance level.
Finally, at a certain point during the trading activity, a break in the resistance occurs beyond the highest point that was reached in between the two troughs. As the resistance breaks, the potential for support increases and the new support level is now tested.
The test is a second chance to close a short position or initiate a long position. In this case, the best way to determine the price target is to estimate the distance from the breakout of resistance to the low point of the troughs. In other words, the extent of the double bottom pattern formation indicates the size of the potential advance.
When a trader identifies a double bottom pattern, it suggests that there is a viable opportunity for entry. Traders consider this beneficial as it indicates that the stock may not plummet any further since a critical level of support is already achieved.
The double bottom pattern is one of those reliable trading patterns which signify the beginning of an upward move in stock prices.
Traders interested in taking on short-term risks are in the best situation to start buying as soon as they spot the double bottom pattern. A trader may sometimes end up spotting a false double bottom pattern.
However, losses are minimal even if there is a misinterpretation as they can quickly find out when the double bottom fails.
In most cases when the double bottom is accurately identified, investors can successfully make quick profits.
Double Bottom Pattern Trading
Although the double bottom pattern has several advantages over other forms of candlestick patterns and is much more reliable, you can only make sure you are trading successfully if you are mindful of certain key steps while carrying out the final trade
Your first step is to identify the phase of the market.
A reversal may be evident many times on a candlestick chart types. However, the prevailing conditions in the market may tell another story. That is to say, a market may be going downward, rising upward, or simply travel sideways.
When the market phase has been accurately identified, half the work with your technical analysis is already done, and your decision is most likely to be successful.
The next step is to understand the historical precedent. A successful trader waits until two rounded bottoms are spotted before initiating any transaction.
Experienced analysts are able to successfully discern the presence of a rounded bottom in spite of magnitude and size associated with the structure of the pattern.
The third indicator of trading success is the accurate estimation of variation between the two bottoms. The presence of 10 pips or fewer between the two bottoms is a good sign to carry out successful trading. It is most unlikely that the two bottoms occur at exactly the same level.
That said, an opportunity for a trader to make a buy decision occurs when the close of a breakout candle occurs above the neckline.
Double Bottom Pattern Target
In this pattern, there will be two low points or two bottoms. Now, find the distance between a bottom till the neckline.
Let’s say that distance is X.
Now, extend the same distance X from the neckline to the point above the neckline. Let’s call this new high point Y. With this, the neckline will become a sort of a centre point between the bottom and Y.
Mathematically, if we consider the support and resistance levels, then it can be calculated as follows:
T = Target
H = Height of the Pattern
R = Level of Resistance
To calculate the target, it can be simply said:
T = H + R
Try out figuring the target, next time you see a double bottom pattern in a chart. It will be pretty smooth!
Conclusion
There are a few insights which may help you trade successfully with the double bottom pattern. The first aspect is to ensure that the primary price trend for the index or the stock is down.
It is important to ensure that trading begins under a bearish trend line. This trading strategy may not be successful in the bull market as a similar pattern may likely indicate a bear trap.
Lastly, as indicated earlier, sell signs in the preceding pattern validate the success of trading with the double bottom pattern. To ensure that your decision is viable, you could make use of the bearish relative chart with a downtrend for an extended period.
A bullish relative chart is not necessarily needed unless you experience long-term relative resistance. Another key consideration is the market sentiment.
Therefore, the double bottom pattern is quite simple, and trading with it may mean success based on the insights covered in the sections above.
As a successful trader, you require a good understanding of the pattern formation, placement of its stop signal, and the determination of the price target to achieve trading success with the double bottom pattern.
In case you are looking to get started with stock market trading or investments in general, let us assist you in taking the next steps forward:
More on Share Market Education
In case you are looking to learn more about Chart Patterns, here are some reference articles for you:
Summary
Reviewer
A Digital Blogger
Date
Broker Name
Double Bottom Pattern
Overall Rating
