


Looking for Low Brokerage, High Margin & Free Tips?
How to do Technical Analysis of Stocks
| | FAQs, Trading | No Comments
More on Share Market Analysis
Share market trading comes up with multiple opportunities for a trader, and to reap its benefits it is important to do an in-depth analysis. Here for a short-term trader, it is important to understand the trend, volatility, and momentum of a stock. But the challenge that comes in the front is how to do technical analysis of stocks?
If you are a beginner trader and want to gain an understanding of the stock market then here is complete details and steps that help you to perform the technical analysis of stocks in the Indian share market.
So, let’s get started.
Technical Analysis of a Stocks
Before getting into the detail of the topic, let’s throw some light on the meaning of technical analysis. Now there are thousands of stocks listed in the Indian stock market, but not all of them are able to give you potential returns and profits.
In fact, traders always look for the stock that follows a specific trend, is traded in volume, has good volatility, etc. To get an understanding of all these factors one needs to do a technical analysis.
By definition, technical analysis is the study of the trend, momentum, and volume of a stock that helps a trader in determining profit and other benefits.
Technical analysis uses statistical information and considers the historical data of the stock to predict the future move. For example, a technical indicator, and moving average helps a trader in determining the trend in the market by considering the closing price data of days, weeks, or months.
It works on the fact that the past movement of the stock has a great impact on the present and future move which eventually helps a trader in booking the profit. Also, it makes it easier for them to evaluate the risk and losses associated with the trade.
Now there are different technical analysis tools that help you in determining the market moves and in choosing the right stock for short-term trades.
How to do Technical Analysis of Stocks in India?
We discussed the technical analysis’s meaning and the factors that can be determined using the tools and techniques of technical analysis. But what are the factors that need to be considered and how to perform it?
Since technical analysis is all about understanding the trend, volatility, and another aspect of the market and stocks, therefore one must have a basic understanding of charts and indicators.
Further, it is important to have an understanding of strategies that should be followed to get a better output of the result.
Here for example, as a trader, it is important to specify your trading style before getting into the analysis. Doing technical analysis for intraday is different from doing it for swing and positional trade. This is because, the setting of charts, choice of indicators, and other parameters change with the time frame you choose for your trade.
So for doing technical analysis, the first and foremost thing is to determine your trading style. After this, look for the stocks for which you want to do technical analysis. For this, you can rely on some news or research tips provided to you by your stockbroker.
Generally, the stock under market gainers or losers could be part of your trading watchlist. Now all the stocks on the watchlist could not bring in the potential profit, so here to pick the best one or two stocks, you can move ahead to do an in-depth stock analysis.
The steps to be followed for the technical analysis of stocks are as follow:
1. Determine the Trading Style
Technical analysis is generally done for short-term trades that include intraday trading, swing trade, and positional trade. All these trading styles come with different opportunities and involve different trading strategies.
For example, for positional trading, your profit expectation would be different from swing and intraday.
Now, this is possible to decide only if you use the right strategies that are discussed in detail below.
2. Choose Stocks
Now on the basis of your trading style, pick the stocks that can give you potential profit in the defined time frame. Again the stock that can give you profit intraday, might not be able to make a good profit in the positional and swing trade.
Choose the stock by following news and other market information.
To give you a better understanding of the same, let’s say that Reliance company is going to submit its quarterly report in the next few weeks, and analyzing its data you are sure that the company has made a better profit than the last quarter that can push its stock price little higher in upcoming days.
Here you can thus consider buying Reliance share and selling it after weeks or months after booking a good profit. In all to choose the right stock, you need to stay updated with the market and company’s news and updates.
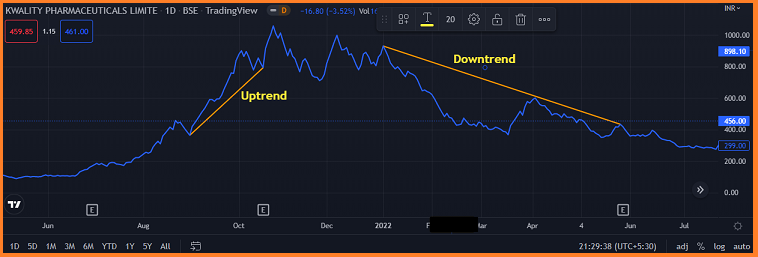
3. Follow the Trend
Now the stocks you have chosen for day trade should make one proper and defined trend. Here the stock making a bullish trend opens a gateway for a long position for traders, while the bearish trend gives an opportunity to make a profit with shorting.
To determine the trend, open the chart of the selected stock. To know the trend, it is better to use a line chart as it gives you a clear understanding of the trend.
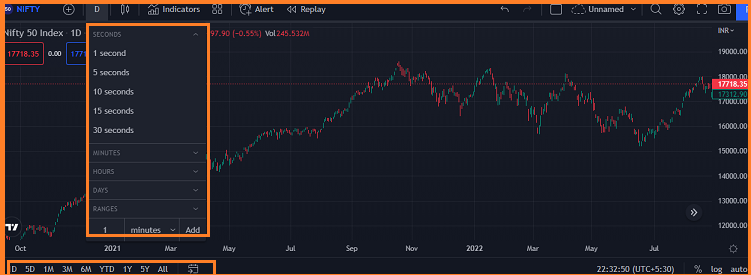
4. Choose the Right Chart and Time Frame
Now there are different types of charts (line, bar chart, candlestick charts) that gives you a basic and advanced level of understanding of a particular stock. For example here, if you want to know the movement and information of open, high low, and close prices then you can use candlestick charts.
Next comes the time frame.
Here for swing trading generally a trader rely on the monthly and weekly chart for analyzing the charts. You can set this time frame as per your trading style, the higher the holding period higher will be the time frame of the charts.
In the chart below, the upper rectangular box defines the time frame and the lower highlighted box is to set the chart time.
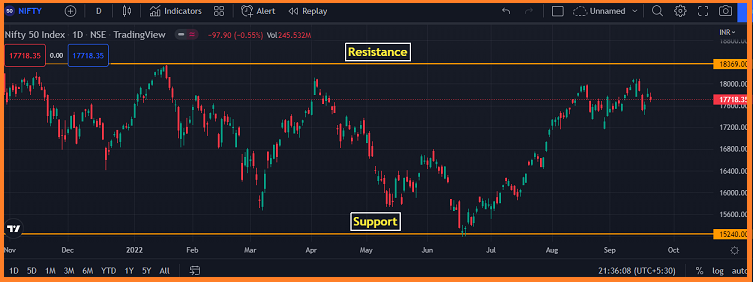
5. Identify Support and Resistance at Different Time Frames
Once the trend is determined, draw the potential support and resistance level in the chosen time frame. Here if the stock is in the uptrend, and trading below its last resistance level, then one can assume that it can go up to its resistance, and hence the trader can set their target price accordingly.
On the other hand, the support level helps traders in determining the stop loss value.
For better trade and to determine different levels of stock movement, one should consider multiple support and resistance at different time frames.
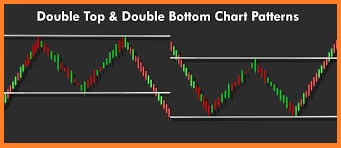
6. Determine the Chart Pattern
There are different types of chart patterns that can be easily determined using candlestick charts. For example for swing and positional trading the double top and double bottom pattern gives you the signal of bearish and bullish trends respectively.
Similarly, there are other patterns like:
- Flag Pattern
- Pennant Pattern
- Cup and Handle Pattern
- Inverted Cup and Handle Pattern
- Head and Shoulder Pattern
7. Use of Technical Indicators
Further to know the traders’ activity one should use the technical indicators. These technical indicators give you an understanding of the trend, its strength, volatility of the stock, and volume.
For example, if the stock is in an uptrend, the ADX indicator helps you in determining the strength and hence you can take a call to take a long position. On the other hand, the RSI indicator gives you an understanding of market momentum and the reversal of trends.
If the RSI value is 70 and the stock is in an uptrend, then there are chances that the market will soon go into the reversal phase. Here the traders in a long position can consider booking the profit.
Some of the best Intraday trading indicators and their features are enlisted in the table below:
| Technical Indicators | |
| Moving Average | Trend Indicator |
| Relative Strength Indicator | Momentum Indicator |
| ADX | Strength Indicator |
| Bollinger Bands | Volatility Indicator |
| MACD | Momentum Indicator |
These are some of the basic steps that one can follow to do technical analysis of stocks at different time frames. Let’s discuss some of the specific things that an intraday trader and option trader should consider to do a technical analysis of stocks.
How to do Technical Analysis for Intraday Trading?
Intraday trading, the most chosen trading type in India, helps you in making a profit in the shortest time and could be the reason of the biggest loss as well. Doing proper research and technical analysis makes it easier for you to pick the right stock, make the right entry, and determine the stop loss.
Here are the specific settings and strategies for technical analysis for intraday trades:
For trend analysis, traders generally choose a longer time frame. For example, here in the case of intraday trading, determine the trend using the 1-week chart and then set the time frame to analyze the stock movement on daily basis.
Intraday trading technical analysis works to give better results on the 1-Day chart at a 1-minute time frame. However, if you want to decrease the sensitivity of the chart, you can choose for a 5-minutes, or 15 minutes time frame.
Here you can also do analysis using different time frames on a daily chart.
Now, this gives you a better understanding of the stock movement.
2. Intraday Trading Chart Pattern
Apart from the general chart patterns discussed above, there are some specific single, double, and triple chart patterns that help you in confirming the trend and take the right position.
Some of the common are discussed in the table below:
| Intraday Trading Chart Patterns | ||
| Hammer Pattern |  | Gives an indication of end of downtrend and gives a bullish signal |
| Green Marubozu |  | Gives a signal of reversal after downtrend |
| Hanging Man |  | Small body with long wick formed at the end of uptrend and gives a signal of bearish trend |
| Three Black Crows | 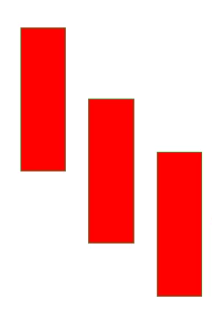 | Three red candle formed after uptrend signalling the upcoming bearish trend. |
| Shooting Star |  | Inverse of hanging man with a short body and long wick depicting end of uptrend |
There are many more chart patterns formed by a single or multiple candles giving specific trend information to traders.
3. Use Technical Indicators
Now there are more than 100 technical indicators and each of those comes with respective benefits. Here for an intraday trader, using technical indicators proves to be beneficial only when they choose the right type.
For example, to determine the trend, one must rely on the moving average. Now a single indicator can also misguide you and therefore one must use a combination of two or more indicators. Here it should be noticed that sometimes using too many indicators can also confuse you.
For this, the combination of the three indicators is ideal for intraday or any other trades.
Now, this combination should include a strength indicator (ADX), volatility (Bollinger Bands) and momentum indicators (RSI). You can make a combination as per your strategy as well.
The ideal combination of technical indicators increases the chance to maximize the profit in the intraday trade.
How to do Technical Analysis for Options Trading?
Options trading is a little different from equity trade. Here the buyer and seller tend to make a profit from the premium which completely depends upon the strike price and trend of the market. So, apart from the price (premium), one needs to choose the right strike price.
Here you can make money irrespective of the trend and here the volatility is generally high. A trader should not only consider charts and indicators for stock analysis but also the option chain to trade options.
Options trading gives you the chance to earn profit in every market condition. For example, a bullish trend opens a gateway to buy a call option or sell a put option, the bearish trend comes with an opportunity to sell a call option or buy a put option and the sideways market offers you the chance to sell an option.
So, trend determination is the most important step in options trading. Other than these other factors to be considered for options trading technical analysis are:
1. Read Option Chain
The option chain provides you the detail of the call and put option value at different strike prices along with other data.
It also helps you in determining the percentage changes occurring at different prices. This gives you an understanding of market movement.
You can better use option chains by using its advanced features and Options Greeks.
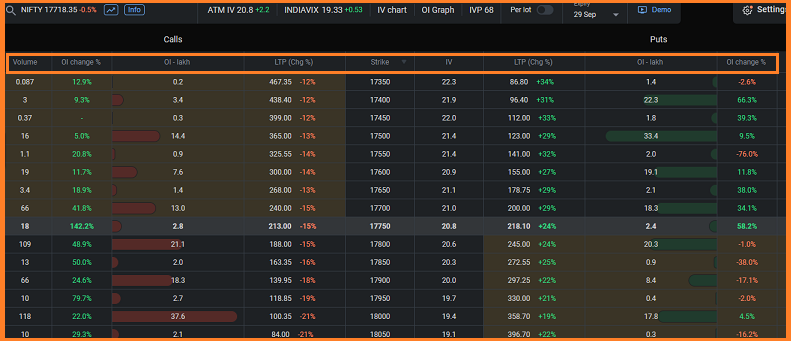
Below is the option chain of Nifty where you can easily find the details of strike price for the call and put options and the respective data in different columns.
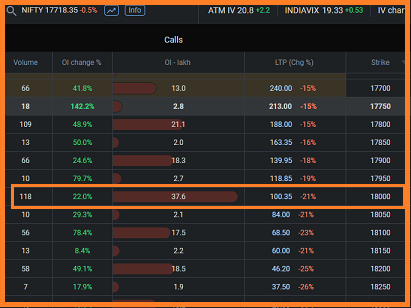
Open interest in options gives you information about fresh open positions in the market. Every new seller and buyer in the market adds to the value of open interest.
Now, this data is generally studied by keeping a seller’s perspective in mind. So high open interest along with decreasing option pricing (premium) in call and put options depicts that sellers are aggressive at that particular strike price.
To give you a better understanding look at the chain below, the OI data of the call option where at 18000 strike price there is maximum OI and the corresponding value is declining. This clearly states that the sellers are aggressive at this value and this could be a potential resistance level.
On the other hand, the PE Open Interest value helps in determining the support value and the seller’s behavior.
3. Consider Implied Volatility
Unlike historical volatility which gives you an understanding of how volatile the stock was, implied volatility gives you an understanding of the expected future volatility.
This is considered for analyzing the option and future market.
High implied value gives an indication of a high premium and vice versa. This helps buyer to pick the strike price with high IV as they can make potential profit with the growing premium value.
Conclusion
Technical analysis is complex and one needs to understand every aspect deeply to do it in the right way. Above are some of the basic and advanced parameters that help you to do technical analysis seamlessly.
To get a better outcome, make sure you choose a stockbroker that gives you different facilities to do technical analysis simple and easy. For this, look for the one offering multiple charts features, and indicators.
Also, there are brokers providing you the technical aspects of the stock and market. So, pick the one with the maximum facilities and benefits.
Want to begin your trading and investment journey in the stock market? Get in touch with us now, and we will assist you in choosing the right stockbroker and in opening a demat account online for FREE!
More on Share Market Analysis