


Looking for Low Brokerage, High Margin & Free Tips?
Zerodha Technical Analysis
| | Research | No Comments
More Stockbroker Research Reviews
Technical analysis of stocks implies predicting stock prices on the basis of previous trends of price movements and volumes traded.
Intraday Technical analysis in the share market is generally done with the help of charts and technical indicators. In this article, we will learn how technical analysis is done through the different trading platforms of Zerodha.
Zerodha Technical Analysis Tutorial
Technical analysis is done by technical tools which are made on the basis of different technical Indicators. Zerodha platforms like Zerodha Kite, have more than 80 technical indicators, and many types of technical charts which can be customized on the basis of different time frames like monthly, weekly, daily, hourly, etc.
This type of analysis can help you a lot for your intraday trading as well as swing trading. In fact, there are a few Zerodha Intraday tips that as well that you may want to consider.
Anyway, for now, let us discuss some specific techniques to know how to do technical analysis of stocks using the Zerodha platform.
1. Exponential Moving Averages (EMA)
This is one of the most commonly used techniques of technical analysis which basically measures trends over a period of time. The simple moving average (SMA) takes into account the average price data.
Calculating SMA is simple! All you have to do is add up the closing prices of the specific stock for given time duration and then divide that sum with the same number of periods.
Whereas when it comes to calculating EMA, more weight is given to the more recent price data. Since it is more sensitive to the price movement of stocks, it helps in identifying trends and trend reversals.
Zerodha technical analysis can be done using EMA through their platforms all that is required is the best EMA for intraday or another kind of trading.
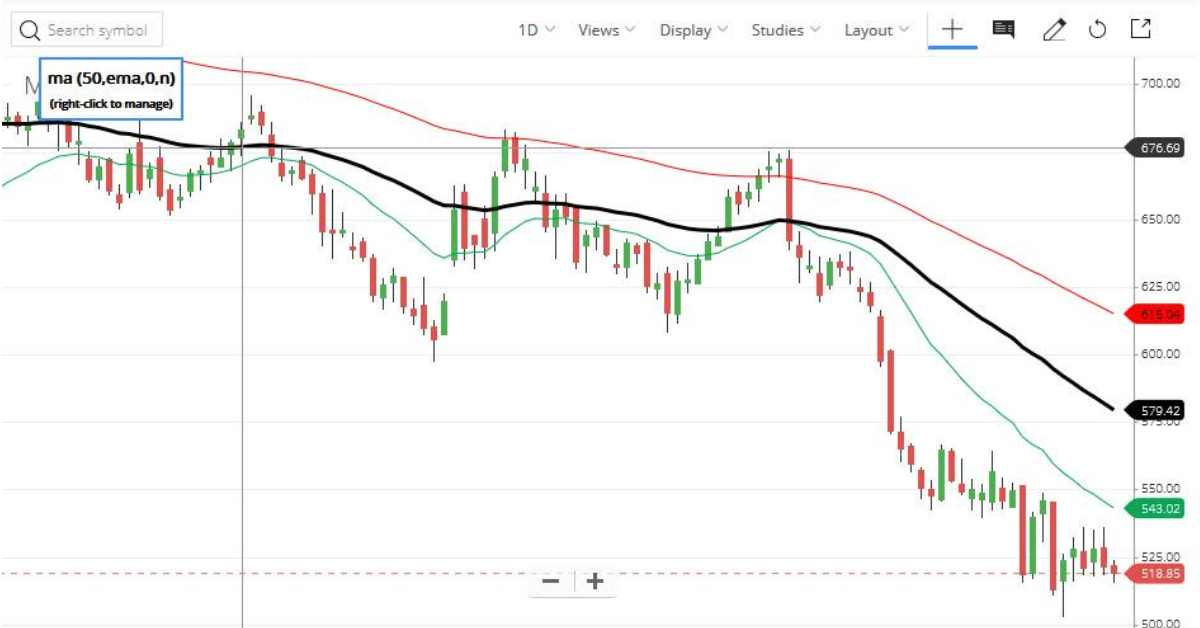
For this, let us look at different days EMA in a chart of M&M stock on the Zerodha Kite platform. The black line in between shows a 50-day EMA. The red and green lines above and below the black one show 100-day EMA and 20-day EMA respectively.
2. Support and Resistance
EMA can also indicate resistance and support levels.
The rising EMA lines can be seen tending to support price action whereas the falling EMA lines are observed to resist the price action.
One should consider buying a stock when the current market price is close to the rising EMA and selling when the current market price is close to the falling EMA.
Zerodha Technical Analysis With Kite
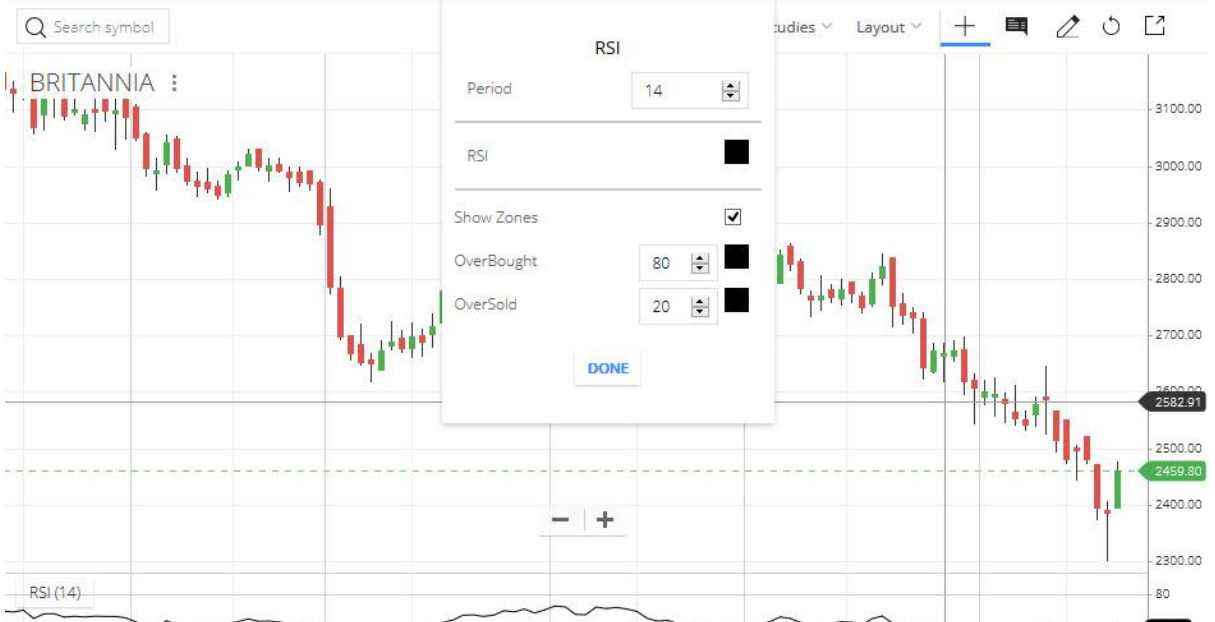
The technical indicator RSI is a momentum indicator measures the most recent changes in stock prices in order to analyse if a stock is in the overbought or oversold zone.
When RSI line crosses above 80 or sometimes 70, an overbought condition is considered and when RSI line crosses below 20 or sometimes 30, an oversold condition is considered.
Buying and selling decisions can be taken when the RSI of stock has spent some time in either of the regions.
Now, let us see how RSI indicator can be included in the settings of Zerodha Kite and Kite mobile. One can open the charts of any stock and go to the option “Studies”.
A number of technical indicators will appear from which one can select RSI and fill the details like period and levels of overbought and oversold condition as per one’s preference.
Zerodha Technical Analysis Using Volumes
Volumes traded plays a very important role in making decisions to buy and sell stocks using technical analysis. Higher volumes indicate the strength of the trend and liquidity in a particular stock. Liquidity is one of the most important things to look while trading in stocks for the short term.
Analysis of volumes traded along with the stock price movement can give useful insights for technical analysis. An increase in stock price accompanied by an increase in volumes of trading shows a clear bullish trend.
On the other hand, an increase in stock prices with a decrease in volume traded shows weak hands buying the stock and one should remain cautious while initiating a trade in such a stock.
Similarly, a decrease in stock price along with an increase in volumes traded is a clear bearish sign. On the other hand, a decrease in stock prices with a decrease in volume traded shows weak hands selling the stock and one needs to remain cautious in such cases.
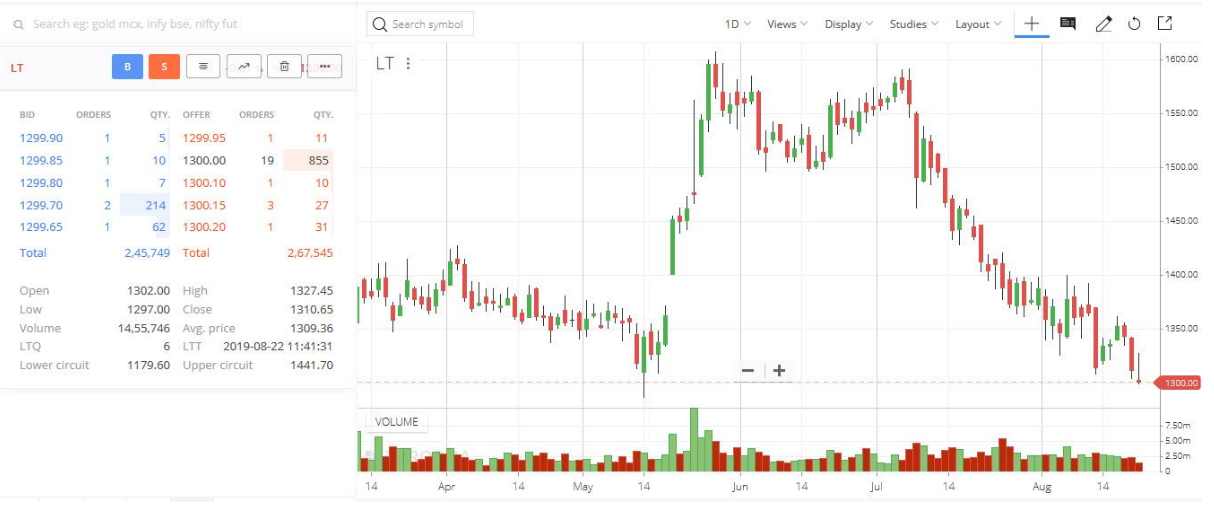
Let us see how we can see volumes on charts on Zerodha platforms.
The picture below shows volumes information of Larsen & Toubro:
Zerodha Technical Analysis With Pi
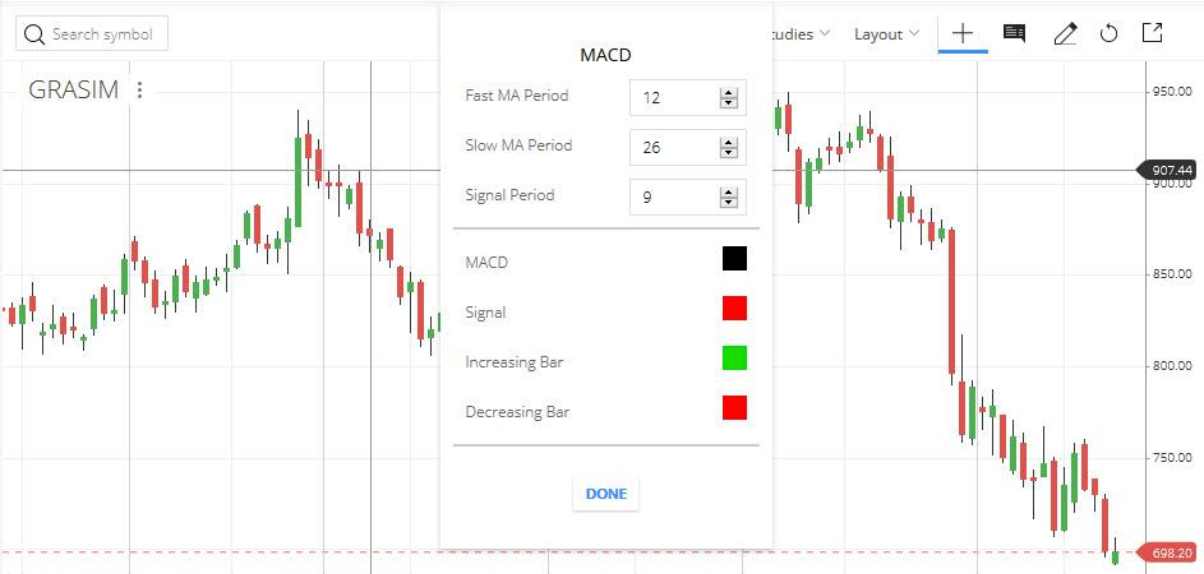
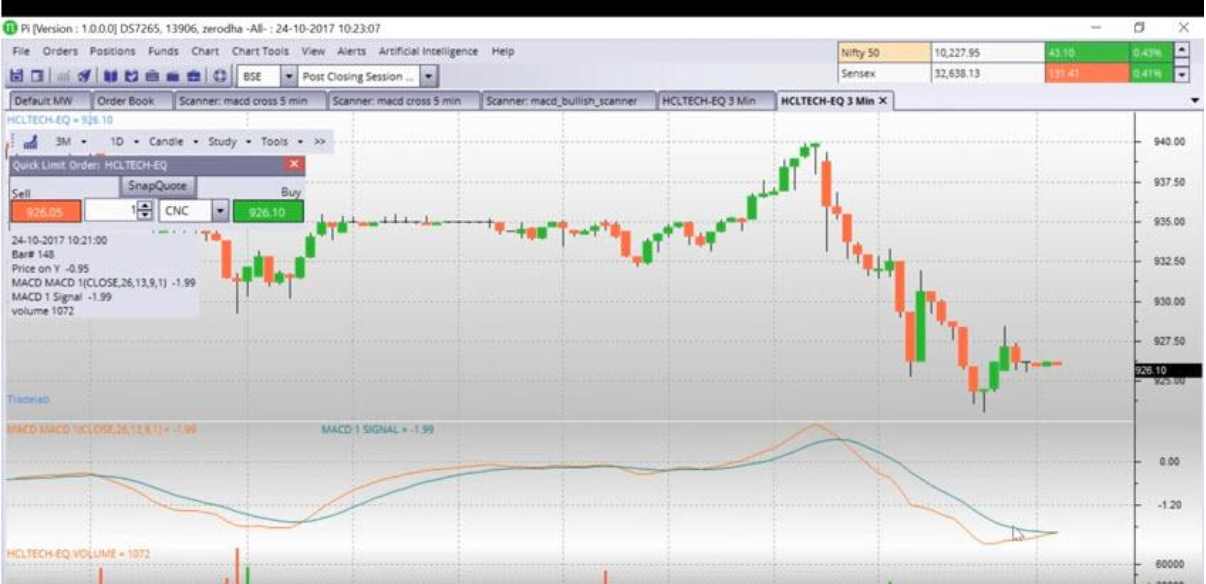
MACD or Moving Average Convergence / Divergence is a trend-following momentum indicator which is found out by subtracting 26-day EMA from the 12-day EMA.
When the MACD line crosses over the signal line, this situation is called a bullish crossover and can be treated as a buy signal. On the other hand, a bearish crossover is introduced as soon as the MACD line crosses below the signal line. This could be treated as a sell signal.
It can be set on Zerodha’s platforms in a way that has been shown in the picture below. The chart of Grasim is showing settings done on the basis of MACD:
Zerodha technical analysis using all the technical indicators can also be done using Pi. Scanners can be created using technical indicators which will give automatic alerts as soon as the conditions mentioned in the scanner are fulfilled. For example, a bullish crossover scanner was created in Pi at the start of the day.
During the day, as soon as the bullish crossover happened in HCL Tech, an alert was generated on the Pi platform. When clicked on the chart, one can see the crossover happening.
Please refer to the picture posted below:
One can initiate a trade on the basis of this alert.
In a similar way, many scanners can be created on Pi using as many technical indicators as one wants. Alerts would be generated automatically on the system and will not require manually checking each company’s charts in order to find a trading opportunity.
Zerodha Technical Analysis Using Bollinger Bands
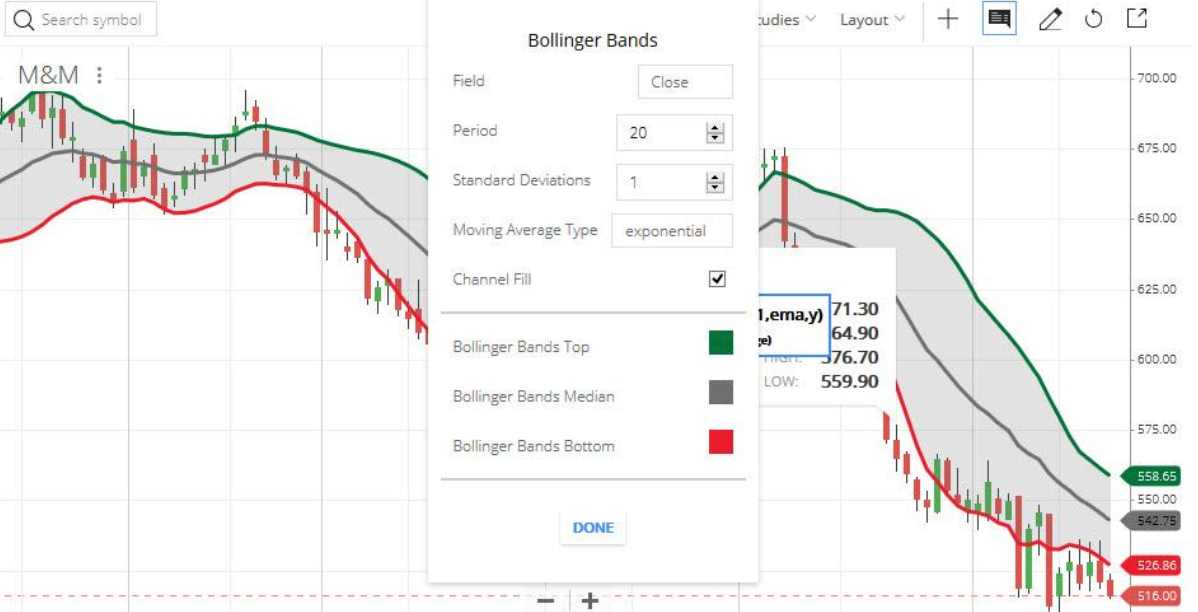
Bollinger bands are a Zerodha technical analysis tool to characterise prices and volatility of stocks over a period of time. The definition of a Bollinger band is a set of lines plotted 2 standard deviations away from a simple moving average.
The movement towards the upper band shows strength in stock and a movement towards the lower band shows weakness in the stock.
Now, let us see how the chart of any company can be made to show the Bollinger bands on Zerodha Kite.
One needs to go to studies and fill in all the required fields in order to view Bollinger bands on the chart of any stock. The below picture shows Bollinger Bands on the chart of M&M:
Zerodha Technical Analysis Using Heat Maps
A heat map is the representation of prices of a stock in the form of a map where different stock prices are represented as colours. Colours of the heat map show changes in stock prices in percentage terms.
Different colours are used to indicates losses and profits in different heat maps. A heat map bar feature could be found out on the older version of Zerodha trader platform.
This feature could be used by pressing “control + f” (Windows) or “Command + F” (Mac) on the market watch. The heat map window that appears needs to be resized to get a proper view of it. In this, the blue colour is used to indicate profitable stocks and red colour for loss-making stocks.
The bluest stock is the maximum gainer and the reddest one is the biggest loser among the stocks in one’s watch list.
Also Read: Is Technical Analysis Profitable?
Conclusion
Zerodha technical analysis is a user-friendly and convenient way to detect trading opportunities in stock markets. One should become familiar with different functionalities provided in Zerodha platforms like Kite and Pi.
These platforms contain all the technical indicators one needs to design a good strategy to make trades in stocks. Stay aware, stay invested!
In case you are looking to get going with your stock market investments and trading, let us assist you in taking the next steps ahead:
More on Zerodha
If you wish to learn more about this discount broker, here are a few references for you:
Summary
Reviewer
A Digital Blogger
Date
Broker Name
Zerodha Technical Analysis
Overall Rating
