


Looking for Low Brokerage, High Margin & Free Tips?
Technical Analysis of a Stock
More on Share Market Analysis
Stock market prediction is a challenging task, it is difficult to say that what would be the potential move in the share market, and Technical analysis of a stock is the study of the historical data of stocks, including volume and price. The aim of technical analysis is to use past behaviour of the stock to predict the future price.
In a volatile equity market, every investor wants to use the best method to analyze the stocks. Technical analysis is generally used to capture the markets up and downs in coming one or two weeks. It is the analysis of short-period price prediction.
Let’s have a quick look, in this review, on how you can carry on with the intraday technical analysis of stocks before placing an order in the stock market. This also needs to be understood that you can definitely learn technical analysis and ideally you must be doing that.
Nonetheless, let’s understand the concept first.
Technical Analysis of Stocks India
Technical analysis of stocks is a method of analysis of stocks by using historical chart pattern of stocks which are publicly available. This method of analysis is mainly associated with equity but can be used for some different types of securities also.
In other words, Technical analysis means predicting the behaviour of the stock price by looking at the previous trends of price and volumes by using their charts and other technical indicators. It is generally used by short-term traders who want to make quick money by observing patterns in stock prices.
They do not concern themselves with the overall health of a company and are not interested in knowing the fundamentals of the company before investing in it.
Historically, technical analysis evolved from the theories of Charles Henry Dow, who is known as the Father of Technical Analysis.
Behind this whole concept, there are three Dow’s theories which serve as the basic assumptions behind technical analysis.
Technical analysis Vs Fundamental Analysis
Fundamental analysis of stocks focuses on a company’s financials, management, economic policies etc. to do an analysis. With a change in numbers of financial, future stock price prediction changes. It is the most common method used by market participants to analyze a stock.

On the other hand, the Technical analysis of stocks focuses on past price chart patterns and predicts the future price of the stock.
Both fundamental and technical analysis is used for future price prediction of stocks but takes different data into account for analysis.
Technical Analysis of Stocks Assumptions
While you delve into the depths of stock market analysis, there is a set of few assumptions that you need to consider, otherwise, you may just end up getting confused and placing loss-making trades.
Here is a quick look of such assumptions using in technical analysis of stocks:
1. Stock Price Already Reflects All Known and Unknown Information in Public Domain:
As per this theory, all the factors that can have an impact on the stock prices have already been discounted in the current stock price. Therefore, it is safe to assume that the current stock price is of fair value. It is neither underpriced nor overpriced.
2. Prediction of Price Movement is Possible:
This underlying assumption means that the price movements of any stock can be charted and predicted. Although there are some random movements, however, the stock market is also full of identifiable tends which, if spotted, can make huge gains for the traders. The whole theory of technical analysis revolves around “Trends“.
3. History Repeats Itself:
This one seems quite obvious after reading the first two assumptions. Technical analysts believe that people react to price movements in remarkably similar ways.
For example: In bull markets India, traders want to earn more and more and thus, keep on buying despite high prices.
Now you must be wondering about what a Bull Market is? No worries, click here to read in detail about the Bull Market.
Similarly, in bearish markets, people have negative sentiments and focus on selling even though the prices at that time are quite low.
Now, let us discuss the ways in which the activity of prices is captured on a daily basis to observe trends. There are four prices that are recorded during the day:
- Open: This is the first price at which a trade gets executed when markets open in the morning.
- High: This is the highest price at which a trade could be executed during the trading day.
- Low: This is the lowest price at which a trade could be executed during the trading day.
- Close: This is the last price at which the markets got closed. This is an important indicator of whether the day had been bullish or bearish. If the open price is lower than the close price, the day is considered to be a positive day and if the close price is lower than the open price, the day is considered to be a negative one.
How to do Technical analysis of Stocks?
Following are twelve important steps of technical analysis of stocks to understand Dow’s theories of technical analysis.
Dow’s theory is Charles Henry Dow’s theory, who is the founder and co-founder of the wall street Journal and Dow Jones and company respectively. Three of Dow’s investment theories are a good guide to technical analysts.
This might look a bit repetitive with the above section but there is a little change in the overall drift. Following are the theories which explain how technical analysts use them:
1. The stock market reflects all known information
According to the first theory; the stock market reflects all known information. Known information refers to all those information which are available by any means publicly. Technical analysts don’t take any financial information into account for analysis.
They don’t relate themselves to the price-to-earnings ratio (P/E), Return on equity ratio, shareholder equity or any other ratio like fundamental analysts.
2. Price movement can be predicted:
According to this theory, the price movement of stocks can be predicted and charted. Everyone knows Price moves randomly and there is not a fixed pattern. But as per theory, this case is not always, price movement repeats itself sometimes or moves in a known trend.
Once you understand the trend, it’s quite possible to make money. You can go with the strategy of buying at a low price and selling at a high price. Also, you can make good positions for future trading.
3. History repeats itself
This theory tells that the history of stock market repeats itself. Means investors and market players react in the same way as they reacted in the past because of the same situation, news or company announcements.
So, Technical analysts use their knowledge of how trader reacted in the past and what was the effect on the stock.
4. Focus on a short period
Technical analysis of stocks focuses on a short period of time like as long as one month and shortest of one minute also. As the purpose of the fundamental analysis is an investment for long-term, but in technical analysis, the focus is for a short period.
If you want to make money in a short period or buying and selling repetitively then this method of analysis best suits you.
5. Use Charts and graphs for stock price trends:
Technical analysis of stocks uses charts and graphs to read spot price trends. A chart tells you a lot about the trend of price movement.
Where the current price of a stock is heading can be easily predictable through charts. Trends can be classified on the basis of duration and types.
6. Uptrends
The upward movement is known as an uptrend. Everyday stock price moves towards a new high and then falls to low as they did previously. You must know that this upward movement at its high is not lifetime high, but it could be high of last day, week or month.
This steady high and low price reflects that the market is positive about the stock. It is an indication that one can buy this stock as this is on an upward trend. So, every time when a stock falls, investors take it as a chance to buy. They don’t wait for the price to fall further.
7. Downtrends
Downtrend refers to a pattern, where stock price falls continuously. You can notice not only peaks are lower but troughs are also lower.
It means market players are convinced that the stock price will fall further. So, investors wait to a little rise in the price to sell their existing positions. At this point in fall, investors never prefer to buy further because of its downward trend.
If you are short term investor then it will be a loss-making position for you, but if you are a long-term investor you may wait for a little more price fall.
8. Horizontal trends/ Sideways
A horizontal trend is a trend in which there is no fixed trend. Only peaks and troughs are constant. But, you can’t decide where to buy or sell a stock.
9. Support and Resistance
Support and resistance are two concepts of price movement in technical analysis of stocks. Price of stock stops and reverses at a certain predetermined price level.
Support is a price level where a downward trend of price movement is expected to stop. At this point, the price of the stock falls and demand of the stock increases which forms a support line.
Resistance refers to the highest price of a stock where it reaches before traders start selling and stock price to fall again.
Once the area of support and resistance is identified, trading will be easier for you. As if the price reaches any of these points, there are two possibilities. First, it may beak that level and go upward or downward. And, second bounce back away from any of two levels.
10. Attention to the trade volume
While performing technical analysis of stocks, if you want to be confident about the trend of the stock price, volume of trades must be watched. You can get much information about what is actually happing in the market through trading volume. If the volume increases with the increase in the price of the stock, the trend is probably valid. And, if the volume of trade increases slightly, probably it is due to the reverse trend.
11. Use of Moving average technique for removing minor price fluctuation
Moving average is a technique to get an idea of a set of a trend. It is useful for forecasting of long-term investment. This method removes unnecessary highs and lows to make overall trend visible clearly. There are many methods for moving average.
Such as Simple moving average, weighted average and exponential moving average.
12. Use of indicators and Oscillators
Indicators is a calculation of technical analysis which supports the trend of information of price movement. It helps you to come to your decision to buy and sell. Leading indicator is useful during a horizontal trend when the movement of the stock is not fixed.
Technical Analysis of Stocks by Charts
There are four kinds of charts that can be used during technical analysis of stocks:
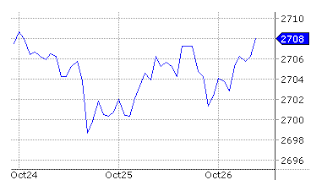
Line Charts: They are plotted by joining closing prices of any stock or index. They can be prepared by checking closing prices on monthly, weekly and even hourly basis.
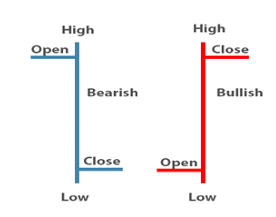
Bar Charts: Bar charts depict all the four key prices of the day, namely, open, low, high and close. The picture below shows how a bar chart can be made and how it shows a positive or negative sentiment during the time period.
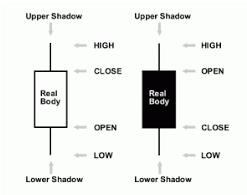
Candlestick Charts: These are the most important ones and the most commonly used by traders. They also depict the open, low, high and close prices of a stock. It looks like the picture below:
A candlestick has three parts:
- The real body: It is made by joining the open and close prices. The bodies of bullish and bearish candles are depicted in different colours. For example: in the picture above, we are using white colour for the bullish candle. i.e. when the open price is less than the closing price. And, black colour is being used to show bearish candle where the close price is less than the open price.
- Upper shadow: It connects the high price to close price in case of a bullish candle. Similarly, in case of a bearish candle, it connects the high price to the open price.
- Lower shadow: It connects the low price to open price in case of a bullish candle. Similarly, in the case of a bearish candle, it connects the low price to the close price.
Candlesticks are easy to interpret and can be made for different time frames like monthly, weekly, daily or intraday charts.
They make certain patterns which help in predicting the future price of a stock or index. There are numerous types of patterns of candlesticks that we will be discussing as a different topic in another post.
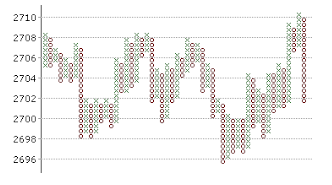
4. Point and Figure Charts: They depict price movements without considering the passage of time. They consist of X’s and O’s that represent price movements in different directions. X’s represent a rise in prices. O’s represent fall in prices.
One X on a graph means one price unit rise and one O means one price unit fall. If a stock price unit has increased four times, a column of 4 X’s is plotted. Therefore, X’s and O’s can never appear in the same column. Please see the picture below for more clarity.
Technical Analysis Books
Now we have already talked about different ways of doing technical analysis of stocks but here is the question of how a beginner can understand all those technical aspects of the market.
Doing technical analysis is not easy and therefore as a beginner, it becomes crucial to get into the depth of each and every important aspect of the market.
For this, one can check for different share market courses, or to gain knowledge at their own level they can refer to some of the books available in the market.
The books no doubt give a better and in-depth understanding of all the major and minor useful concepts of the market. Not only this, they get aware of the terms used in the technical analysis of stocks that further help them in learning.
Here is the list of some of the best books on technical analysis:
1. Getting Started in Technical Analysis by Jack Schwager
Want to learn about oscillators, indicators, price-action, and other important trading tools, then this is the book by Jack Schwager that covers important and almost all the important concepts of the share market technical analysis.
In this book, you would be able to learn about chart patterns, the importance of time frames in charts, the philosophy of trading, and lots more.
In all, it is a one-in-all technical analysis book for beginner traders.
2. Technical Analysis of Financial Markets by John J. Murphy
Knowing the meaning of technical analysis of stocks and its practical application is what is explained in depth in this book. The author tried to cover all the major things that beginner traders should know before starting their trading journey.
Not only the intraday and another short form of trading but also, the book covers the useful aspects of Futures and Options Trading and the importance of technical analysis in the derivatives market.
3. Japanese Candlestick Charting Techniques by Steve Nison
Japanese Candlestick analysis, charting techniques, patterns, etc changes the way a trader views the market. It is the evolution in the stock market that benefits a trader.
If you want to know about these charts and their technical aspects right from scratch than wait no more and get this book now. It covers all the important and useful aspects that defines and make candlestick charts the most popular and useful charts in stock market analysis.
4. Technical Analysis of Stock Trend by Robert D. Edwards, John Magee
If you want to gain an in-depth understanding of the bar charts and other forms of charts used in the share market, then this is the book that helps you in understanding the concepts.
This book was published in the year 1948 and is updated from time to time to give the reader a better context and knowledge in terms of current market conditions.
5. How to Make Money Trading With Candlestick Charts, By Balkrishna M Sadekar
Determining different signals generated from candlestick charts and how to use them in analyzing the market trend, finding the support and resistance level, and the ways to calculate the stop loss value.
All these concepts are explained in simple language by an Indian author. This book helps you in understanding the Indian market in a better way and provides you the knowledge of different strategies useful for short-term trades.
Technical Analysis of Stocks – Summary
Before we end this piece on Technical Analysis of stocks, let’s just quickly revisit the different theories around the very concept itself.
- Understand clearly about all three investment theories of Dow.
- Try to look for a short period of results.
- Try to understand the trends of the stock.
- Get an idea of support and resistance.
- Know about the trade volume in the market.
- Get the overall idea of the trend by using the moving average method.
- Use Indicator and oscillator which Supports what price movements are telling about your decision to buy and sell.
Are you looking to get started with Share Market Investments? Just fill in some basic details in the form below and a callback will be arranged for you:
More on Share Market Education:
In case you are interested to know more about Technical Analysis of Stocks or Online Share Trading in general, here are some reference tutorials for you:
Summary
Reviewer
A Digital Blogger
Date
Broker Name
Technical Analysis
Overall Rating

One Comment
I want to train myself in technical analysis specifically focused on intraday charts