


Looking for Low Brokerage, High Margin & Free Tips?
Learn Technical Analysis
| | Research | No Comments
More on Share Market Analysis
When somebody asks you to Learn Technical Analysis, what exactly do you understand from that? Is it going through some course, reading technical analysis books, watching videos or anything else?
In this quick review, let’s understand what are the best ways for you to learn technical analysis of stocks as it helps you a lot in figuring out top stocks for your short-term trade placements.
Furthermore, does technical analysis work in the context of trading? Let’s start with some basics!
Technical analysis of stocks is analysing stock prices over the last few days or weeks and studying the corresponding volumes traded in that particular stock in order to predict the future stock price over the next few days or weeks.
Learn Technical Analysis in India
The theory of technical analysis is based on the assumption that all the information about a company and all the news related to it as well as its sector has already been reflected in the stock price and that stock prices can be predicted on the basis of previous trends.
If you want to learn analysis of stocks from scratch, you will be required to spend some time and practice daily in order to be more and more accurate in predicting future stock prices.
To learn how to do technical analysis of stocks, it is important to consider four different prices.
- The first one is the open price which is the opening price of any stock when the stock market operations begin.
- The second price is the high price which is the highest price of the stock that has been in the whole trading session,
- The third price is the low price which is the lowest price of that stock in that trading session and
- The last one is the close price which is the price at which the stock stopped trading at the end of the trading session.
Using these four prices, different kinds of charts are made in technical analysis.
Basically, there are four kinds of technical charts and different people use different kinds of charts according to their needs and strategies.
Let us discuss them:
1. Line charts: These charts can be seen in the form of lines joining just the closing prices of different days or weeks or months.
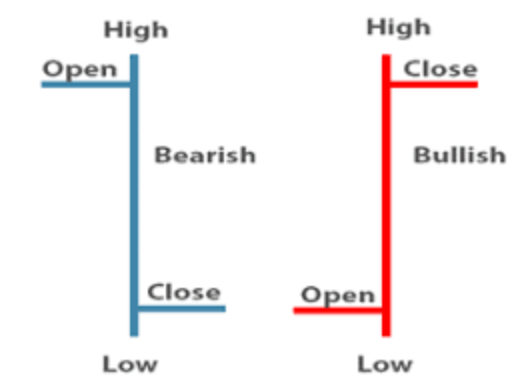
2. Bar charts: These charts show all the four kinds of prices explained above. Please look at the picture to see how they look like:
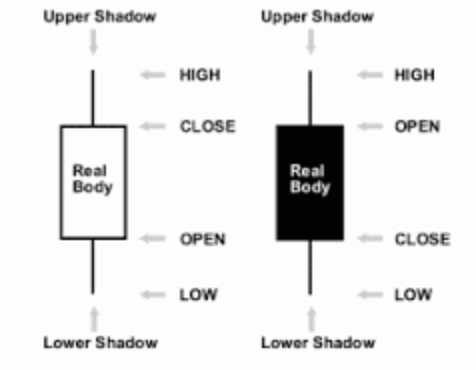
3. Candlestick Charts: These are one of the most important representations of the four prices and are used very commonly by technical analysts. Each types of candlestick chart has a body which is made by joining the open stock price and closing stock price.
Then, there are upper and lower shadows that depict the high and low price of the stock during a particular period of time.
The perfect candlestick chart analysis help in planning to trade strategically.
Please have a look at them here:
4. Point and Figure Charts: These charts are made of X’s and O’s which represent price rise and fall in stock prices respectively. These charts do not show the passage of time in them.
Then, in order to know where to enter and where to exit from a stock, you would be required to gain the knowledge of support and resistance levels.
A resistance level is reached when the bullish forces have been acting for some time and the price has reached such a level where the bearish forces start to push the price down and prevent the stock prices to move further upwards.
Similarly, the resistance level is reached when the bearish forces have been acting for some time and the price has reached such a level where the bullish forces start to push the price down and prevent the stock prices to move further downwards.
These levels help in determining the reversal of the trends.
Traders can start entering in positions when the stock prices reach support and resistance levels in the hopes that the trend will start reversing after reaching those levels.
Also, a study of volumes traded in the stocks is also very helpful in making buy and sell decisions. There are many technical indicators that will help you with share market prediction about the trends and trend reversals are made.
The technical indicators are of two types – Leading and Lagging.
The most common technical indicators that are used by technical analysts are Moving Average Convergence Divergence (MACD) and Relative Strength Index.
If you are a beginner and want to know how to be perfect in technical analysis, then, we would suggest that you should download a stock market education app on your phone called Stock Pathshala and choose the beginner option in it.
It will then reflect some stock market courses online. There are two courses in the beginner section that will help you in gaining all the required knowledge for technical analysis.
For instance, the first one is the basics of technical analysis and the other one is theoretical as well as the practical application of technical indicators and oscillators.
These courses will help you learn not only the theory of technical analysis and technical indicators but also how to apply them in real live markets.
In case you are looking to get started with stock market trading or investments, let us assist you in taking the next steps ahead. Just fill in the form below to get started:
Also Read:
Summary
Reviewer
A Digital Blogger
Date
Broker Name
Learn Technical Analysis
Overall Rating
