


Looking for Low Brokerage, High Margin & Free Tips?
Trend Analysis On Charts
| | Charts | No Comments
More on Share Market Analysis
Trend analysis on charts, is a known concept in technical analysis. It is a technique that attempts to predict the stock price movements in the future on the basis of the recently observed trend of the data of the stocks.
It is completely based on the stock market prediction and the idea of the stocks considering the fact that stocks are going to behave in future in similar ways it did in the past.
This gives traders a clarity about the respective stocks and where they should pitch in their money. Such stock analysis is done for immediate terms, short term and long term markets.
Let’s dig a bit deeper to understand how it works and how you can use it in your trades.
Trend Analysis On Charts: How it Works?
There are a number of terms used in trend analysis.
One of them is Charting which is the name of the analysis of the different price charts which contain the information of the price history of the financial assets. Similarly, there are charting tools which consist of the various drawings like the different trend lines, chart patterns, candlestick charts, support and resistance and other kind of visuals that help the traders in making their decisions.
Trend analysis is done in three different time frames: short-term which lasts from days to weeks, intermediate term which are done from weeks to months and long-term which is done from months to years.
This is how it should ideally be carried out:
- First, you have to create the chart. In order to do so first enter the data in the worksheet, select the data for the chart, then click on insert and select the line option from the drop-down menu in the charts section. Now select the line chart on which you have to display your options
- Now you have to apply the charting tool, trend line. In order to do so, first, click on the chart to display the chart tool which then displays the design layout and the format tabs.
- Now you have to select a series from the drop-down list at the top of the current selection section of the layout menu.
- Click on the trend line option from the trend line drop-down menu and then select the type of trend that is applicable for your use. Then select the right trend line for your data. For any further option, click on trend line and then more options.
Trend Analysis of Charts: Other Features
Here are some other features of trend analysis of charts that you must be aware of:
- Trend Lines
- Cycles
- Trend Line Signals
- Parabolic Trends
Trend Analysis On Charts – Example
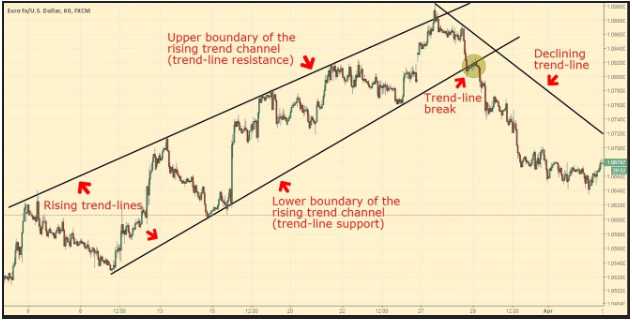
In trend analysis, you basically have to look at the patterns of the previous years and then you have to combine them with human instincts.
There are two things that you have to understand, first, the level of support which is the price a stock can never drop below then and the second is the level of resistance which is the price that the stock can actually not break through, the highest price of the stock which it can never reach.
Now, these lines change when new variables are introduced with might push the stock wither above the resistance or below the support.
Example of trend analysis on charts:
- First login, then surveys, then reports, then advanced and then trend analysis.
- Now you have to select the dataset filter or the report dataset filter.
- Then select the filter result which is actually the type of filter used to apply in the results like completing, started but not completed, terminated via branching.
- Now select the start date or the end date for the time span you want to view the trend in.
- Now you have to select the frequency you want to calculate the trend in like weekly, monthly, quarterly or an annual.
- Now select the output or the report data on the type of report desired.
- Now you have to click on the download trend report data which will then will be delivered onto the email address associated.
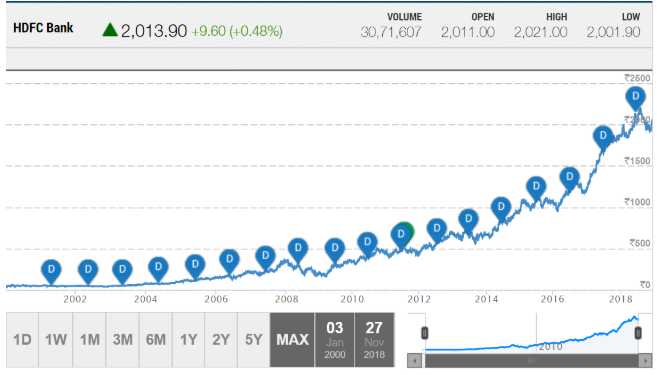
Following the above-mentioned data, you can easily get that the uptrend in the stock price of HDFC Bank. And therefore some trader may consider it a great sign of investment opportunity. But you should not solely consider uptrends as an indicator of investment in some stock.
You should always consider other essential factors while making the investment. Moreover, you can also consider an investment advisor for making right decisions.
Trend Analysis On Charts – Benefits
There are a number of advantages of performing trend analysis on charts:
- There is unlimited data available for trend analysis with the widespread amount that is available and the ever increasing efficiency of the compute to handle that data. This verifiable data can be subjected for validation based on the study of trend analysis
- A trend analysis can also be replicated, checked, updated and refined whenever necessary.
- The use of numbers in trend analysis makes trend analysis more exact and realistic. These numbers help in not predicting but providing a higher probability of a particular event to happen since its probability is higher.
- It is very simple and inexpensive.
- If a proper historical data is available, trend analysis can be easily formulated and differences can also be easily estimated.
- The approach of trend analysis is not exact however it does provide a quick and real assessment of the potential results of that particular program or analysis.
Trend Analysis On Charts – Concerns
The cons of trend analysis on charts include:
- This might be a possibility that historical data might not present a true picture.
- Sometimes the identifying of turning points might be difficult in forecasting trends. The turning points are easy to predict in the hindsight but they are difficult to scrutinize in the beginnings and when mere aberrations occur.
- In order to perform trend analysis on long-term, a high number of data and information are required which might not be available always mainly in cases of new business and new product lines. Such trend analysis might not produce realistic results.
- Also in long-term predictions, the possibility of error increases with the passage of time as during the course some new variables are introduced. This disturbs the forecast of both immediate and long-term trend analysis as these new variables might lead to uncertain events during the forecast.
Trend Analysis on Charts – Conclusion
This approach of technical analysis is helpful in determining and analyzing the market segment and can also analyze the data quickly. It is a process that helps to predict the future trends using the probability of the current trends, performing a kind of comparative analysis on the future stocks.
This helps in predicting current market trends like gains in a market sector or the possibility that a current market trend for one market might develop as a trend for the other market as well.
Although there is no guarantee that this process might yield fruitful results, still it helps in predicting a large set of data and might lead to correct trends too.
In case you are looking to get started with stock market trading or investments in general, let us assist you in taking the next steps forward:
More on Share Market Education
Find other related articles to share market research and analysis here:
Summary
Reviewer
A Digital Blogger
Date
Broker Name
Trend Analysis On Charts
Overall Rating
