


Looking for Low Brokerage, High Margin & Free Tips?
Pennant Pattern
| | Chart Patterns | No Comments
More Chart Patterns
A pennant is one of the many candlestick patterns used in technical analysis of stocks to identify trading opportunities. But what exactly is a pennant pattern, how is it used in your trading and are there any specific risks involved while you use it? Well, we will get answers to these queries in this detailed review here.
Let’s get started with the basics.
Pennant Pattern Definition
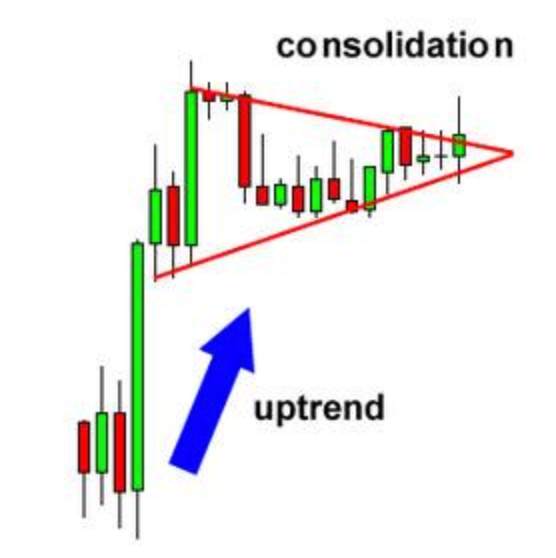
A pennant pattern is a continuation pattern in which a large movement in the price of a security is observed after which there is a consolidation phase and then, continuation of the existing trend.
The large movement in the price of the security is known as a flagpole. This should indicate a sharp move in prices, almost vertical on charts. To identify the consolidation phase, one should look for two converging trend lines.
After the consolidation phase is complete, a breakout in prices of the security can be seen in the same direction as the initial trend. The breakout generally marks the midpoint of the movement of the prices.
Please refer to the picture below to know how a pennant pattern looks like:
Pennant Pattern Technical Analysis
Pennants can be of two types –
1. Bullish Pennant Pattern
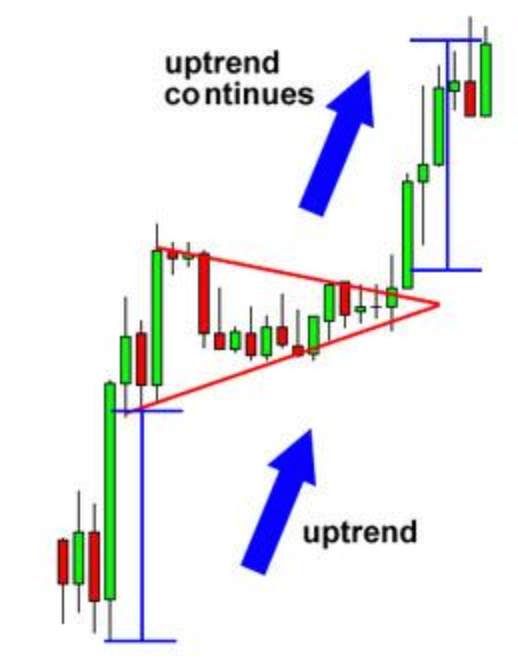
In this, the pennant pattern is followed by a sharp advance in prices of the securities. In this, the pennant pattern is followed by a sharp rise in prices of the securities.
After a long uptrend, some traders close their positions and exit due to which consolidation phase can be seen. At the same time, more buyers start joining the trend causing the price of the security to break above the pennant.
Please look at the pictures posted below to understand the pattern and the breakout:
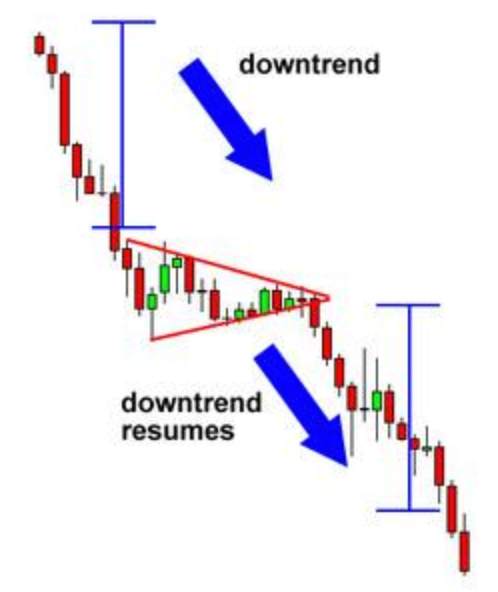
In the picture above, one can see a long downtrend followed by a period of consolidation. After this period of consolidation, one can see a breakout in prices and the continuation of the downtrend in the picture posted below.
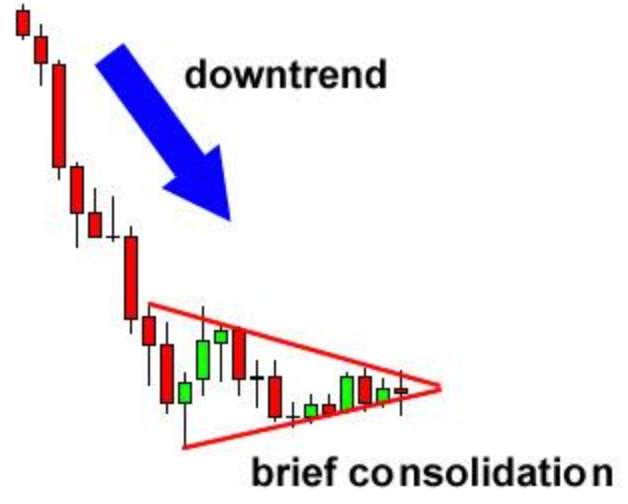
2. Bearish Pennant Pattern
In this, the pennant pattern is followed by a steep fall in prices of the securities.
After a long downtrend, some traders close their positions and exit due to which consolidation phase can be seen. At the same time, more sellers start joining the trend causing the price of the security to break down below the pennant. Please look at the pictures posted below to understand the pattern and the breakout.
In the picture posted above, one can see a long downtrend followed by a period of consolidation. After this period of consolidation, one can see a breakout in prices and the continuation of the downtrend in the picture posted below.
Pennants can be seen in any time frame on the technical charts. It is also important to observe the volumes traded during the entire process of the pennant pattern.
The consolidation phase should have lower volumes traded in comparison with the breakout followed by it. The breakout of prices is generally witnesses along with huge volumes traded.
Pennant Pattern Strategy
Now, let us analyse how trades can be taken with the help of pennant patterns identified on technical charts. Let us discuss how to trade bullish as well as bearish pennant patterns.
1. Bullish Pattern
The opportunity to take a long trade arises after the security prices move up considerably in a short period of time and have shown the consolidation phase.
When the price goes above the trend line and closes above it, it can be treated as a signal to enter the trade. One should also check volumes during the breakout.
The breakout should be supported by large volumes in order to increase the chances of getting a profitable trade.
Now, let us learn how to decide about how to decide the target profit from the trade initiated during a bullish pennant pattern and when to exit the trade without losing out on the movement of prices in a favourable direction.
First of all, one needs to measure the height of the flagpole to the point at which the breakout of the price is seen. That should be extended on the chart to reach the target profit point where it is safe to exit the trade.
Usually, the movement of price after the break out is as much as the price movement before the consolidation phase had begun. Now, comes an even more important task. That is to decide the stop loss for the trade. One should find the lowest price point in the pennant pattern and set the stop loss at that point.
This is because it shows the beginning of a long term reversal.
Bullish Pennant Example
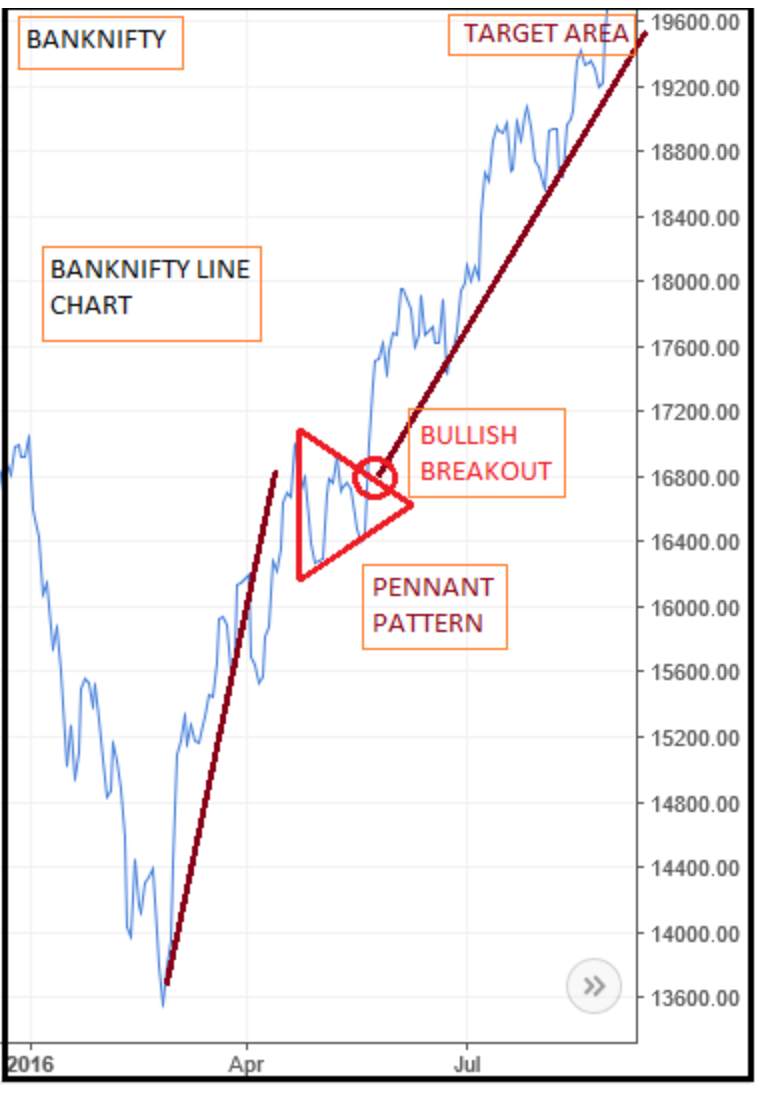
Let us examine a real-life example of a bullish pennant pattern and see how we could have initiated a profitable trade.
The picture posted above shows the technical chart of Bank Nifty. It shows a clear and sharp advance in prices which is followed by a consolidation phase which looks like a triangle on the chart.
This consolidation phase is followed by a steep rise in prices. This bullish breakout would have earned huge profits for the traders who would have initiated a trade at the right moment. One can also see the target profit area on the chart.
2. Bearish Pattern
The opportunity to take a short trade arises after the security prices move down considerably in a short period of time and have shown the consolidation phase. When the price goes below the trend line and closes below it, it can be treated as a signal to enter the short trade.
One should also check volumes during the break down from the pennant. The break down should be supported by large volumes in order to increase the chances of getting a profitable trade.
Now, let us learn how to decide about how to decide the target profit from the trade initiated during a bearish pennant pattern and when to exit the trade without losing out on the movement of prices in a favourable direction.
First of all, one needs to measure the height of the flagpole till the point at which the breakout of the price is seen. That should be extended down on the chart to reach the target profit point where it is safe to exit the trade.
Usually, the movement of price after the breakdown is as much as the price movement before the consolidation phase had begun. On the other hand, the stop loss should be set at the high price point of the pennant pattern.
This is again because it shows the beginning of a long term reversal.
Bearish Pennant Example
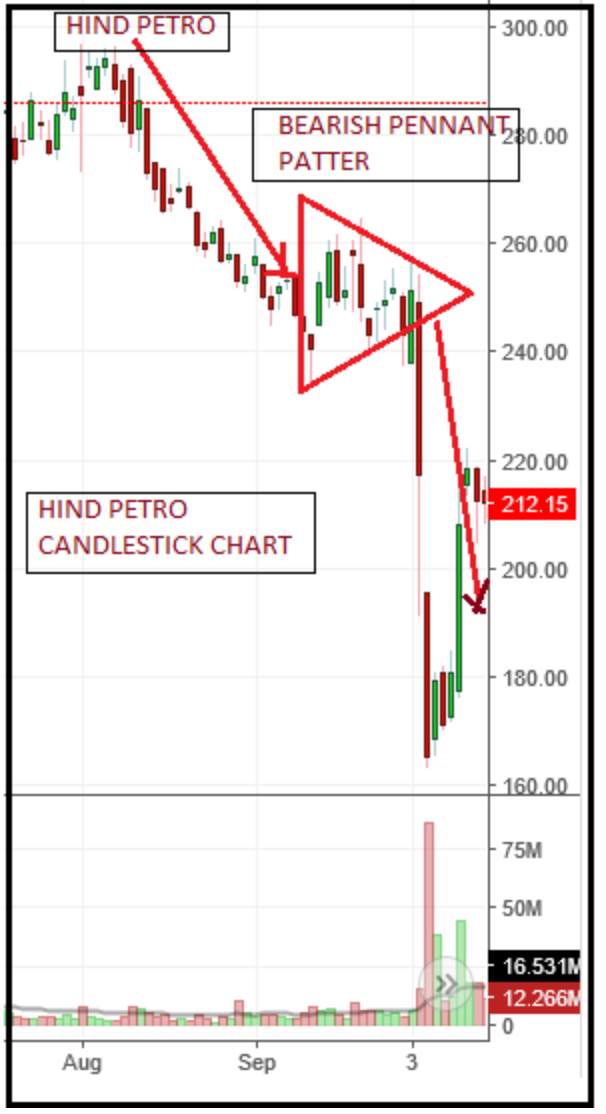
Let us examine a real-life example of a bearish pennant pattern and see how we could have initiated a profitable trade.
The picture posted above shows the technical chart of Hind Petro. It shows a clear and sharp decline in prices which is followed by a consolidation phase which looks like a triangle on the chart.
This consolidation phase is followed by a steep fall in prices again. This bearish break down would have earned huge profits for the traders who would have a short initiated trade at the right moment. One can also see the target profit area on the chart.
If one has identified the pennant pattern correctly, then, one can earn a very high profit in a very small amount of time. And the best part about this trade is that it involves little risk in comparison to the return generated by it.
The risk-reward ratio in trades done in a pennant pattern is quite favourable.
Pennant Pattern Success Ratio
As we know that the success ratio of any strategy is markets cannot be 100%. It is just that with the help of skills and right tools, one can enhance the chances of success in a considerable way. In order to play successful trades using this pattern, one should combine it with other technical indicators as well.
This would increase the chances of the strategy becoming successful.
Some traders use the Relative Strength Index (RSI) levels with pennant patterns to make an accurate stock market prediction about the future price movements. They watch RSI moderate in the consolidation phase and take positions when the RSI shows oversold territory and signals towards a potential rise in prices.
Similarly, other technical indicators also increase the success ratio of trades taken after the pennant pattern.
Pennant Pattern Screener
There are many stock screeners present which can screen stocks on the basis of any defined criteria that can be customised according to the needs of a trader.
Some of them are paid and some are free. Some broking platforms also provide this facility of screening stocks.
In order to initiate a trade after witnessing this pattern, one can use such screeners in order to catch them as soon as the breakout of price has happened after the formation of this pattern on the daily or weekly technical charts of stocks and currencies.
Technical Analysis Books
Want to learn more about this pattern and other candlestick patterns then you can either join a reliable stock market course or begin an understanding by considering some of the books.
There are some of the best books where the author shared some of their experiences, mistakes, and self-made successful strategies of trading.
In all, it helps you in learning the concepts from the experience and failure of other traders.
Here are some of the top books that a beginner trader can refer to gain an understanding of the financial market.
| Technical Analysis Books | |
| Book | Author |
| Getting Started in Technical Analysis | Jack Schwager |
| Technical Analysis Explained | Martin J. Pring |
| Technical Analysis for Dummies | Barbara Rockefeller |
| Trading and Technical Analysis Course | Mandar Jamsandekar |
| Technical Analysis of the Indian Stock Market | Shriram Nerlekar |
Conclusion
A pennant pattern is formed on the charts where a sharp rise or fall in prices of the security is followed by a small consolidation phase and then, the continuation of the existing trend. Pennant pattern can be of two types – bullish and bearish.
Traders can take both short and long trades with a pennant pattern. In case of a bullish pennant, a trader can initiate a trade when the breakout of price happens after the consolidation phase is just over.
One should always remember to check the volumes traded at the time of breakout. They should be definitely higher than the volumes traded in the consolidation phase. Also, every trade should be accompanied with a stop loss.
In a bearish pennant pattern, one can initiate a trade just when the breakdown of price happens after the completion of the consolidation phase. The volumes traded should be higher than the volumes in the consolidation phase.
Once the pattern is correctly identified and the trade has been initiated at the right moment, one stands the chance of gaining good returns.
Traders should make use of online screeners that are used to identify stocks on the basis of specific criteria. They give automatic alerts on the occurrence of any trading opportunity in the stock market.
In case you are looking to get started with stock market trading and investments, let us assist you taking your feet in the right direction.
Just fill in the below form to get started:
Read More:
If you wish to learn more about chart patterns, here are a few references for you:
Summary
Reviewer
A Digital Blogger
Date
Broker Name
Pennant Pattern
Overall Rating
