


Looking for Low Brokerage, High Margin & Free Tips?
Bearish Engulfing Pattern
| | Chart Patterns | No Comments
More Chart Patterns
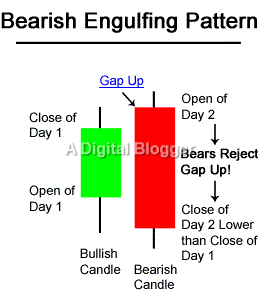
Bearish engulfing pattern is one of the most important technical charts-based candlestick patterns. It serves as a predictor for a future bearish trend. When a small lighter candlestick is succeeded by a larger and darker candlestick, the second candlestick is perceived to engulf the first one, resulting in a bearish engulfing pattern.
It must be noted that the smaller and lighter candlestick consists of short shadows. This pattern is usually spotted during an upward trend in the stock market space. A peak in prices may be set off to a slow down after the appearance of a bearish engulfing pattern.
The bullish engulfing pattern is at the opposite end of the spectrum with respect to the bearish engulfing pattern and depicts an upward trend neutralizing a preceding downward trend in a candlestick chart.
The opening and closing points of a candlestick appropriately represent the open and close prices for a security.
When the open point is found below the closing point, an upward trend is implied. However, when the open point is above the close, a downward trend manifests itself. Extreme prices are depicted by the wicks, graphically representing the high and the low extremes which have been paid for, for this particular security.
Bearish Engulfing Pattern – How to Identify?
The bearish engulfing scenario has very specific dynamics.
The pattern initiates with a candle possessing upward momentum, which is overcome by a second candle, pulling the entire trend line towards a downward trend. A higher secondary opening price, when compared to the primary price, is characteristic of this trend.
It is also important to note that when the second candle moves down even below the lower edge of the first one, the scenario implies a more profound indicator of the downward trend.
The bullish engulfing pattern is a key indicator of drastic changes in market conditions for keen investors. In the presence of a bearish engulfing pattern, investors may choose to trade with the objective of short-term gains. They may sell a specific security if they predict a fall in prices.
This market move allows them to invest in securities which have a larger growth potential. In the case of long-term investors, selling of securities may be the only option as this pattern does not necessarily warrant the existence of a sustained downward trend.
The bearish engulfing pattern has key characteristics.
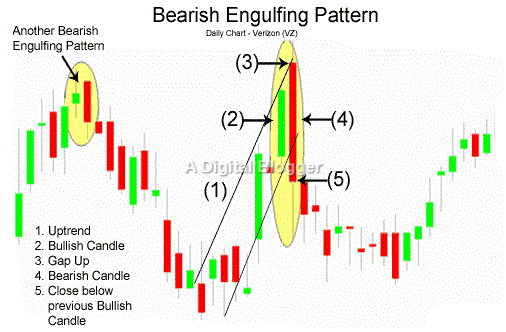
Firstly, an uptrend must exist, which may be either major or minor.
Secondly, observers of the market space must validate if the first candle is the lighter candle and is part of an uptrend.
The second candle is depicted with a darker shade and engulfs the whole real body of the first candle. Prudent traders must look and both preceding and succeeding patterns to make the right decision.
Bearish Engulfing Pattern – Market Dynamics
The uptrend conditions are characterized by price and buying activity and result in a closing scene with a high price. Initially, a bullish candle is formed which occupies the space for the first candle of the bearish engulfing pattern.
During the next day, the price enters a value above its previous day’s high, and buyers start trading once again. Buying activity gains momentum and supply increases. In due course of time, when a decline in momentum is experienced, the prices start to fall.
Consequently, the bulls start buying even more as prices become more affordable. The bears then start giving away shares at a much higher price. Supply increases and surpasses demand. Prices fall even lower, and new buyers start facing losses.
To counteract this, they start selling securities to contain losses within acceptable limits. However, this trend change encourages the bulls to make profits in the long positions.
The bears then continue increasing the short positions as prices fall. Prices keep falling, and towards the end of the session, they close below the body of the previous candle. The bearish candlestick is dark and is now formed as the second candle in the bearish engulfing pattern.
The overall depiction of the candlestick pattern illustrates that the second candle has engulfed the body of the previous bullish candle.
In a typical scenario, when a darker bearish candle engulfs a shorter bullish candle, a strong uptrend is reversed, followed by a downtrend. The trend is expected to continue with the similar momentum, moving even further down, towards the end of the chart. In other scenarios, a bearish engulfing pattern may serve as a hallmark for a price drop.
However, this price drop may not stay in a similar manner for an extended period of time. Such a pattern is often spotted towards toward the end of a trend line, and may not be responsible for a solid reversal in price conditions. However, the arrangement can be technically described as a bearish engulfing pattern since it was involved in a price drop.
Even stable upward trends consisting of bullish candlesticks may be overcome by a bearish candlestick, causing prices to consistently fall once the arrangement is spotted.
Bearish Engulfing Pattern – Key Insights
Although the bearish engulfing pattern is similar to the dark cloud cover candlestick charts pattern, it is a more powerful depiction of the action of the bears.
The bearish engulfing pattern becomes more significant in several situations.
When the opening for the second day falls above the resistance area and its close falls below the resistance area, the pattern is considered more viable. Further, when the second candle possesses a shaven head or shaven bottom, the degree of weariness in the market is much higher.
An increase in volume also makes the bearish engulfing pattern more important. Traders holding long positions can perceive the bearish engulfing pattern as a signal for taking action on the next day. The long position can be covered below the low point of the second day’s darker candle.
In the case of a short trade, the entry point could be the low of the succeeding darker candle for the second day. In this case, losses may be limited by placing a stop-order above the high of the candlestick pattern.
Bearish Engulfing Pattern – Conclusion
When a bearish engulfing pattern occurs, a reversal of the investor sentiment is observed as stocks reach their upper limits. As a result, the stocks are bound to experience a downward trend in the future. Traders can enter into the market using a range of mechanisms whenever they spot a bearish candlestick pattern.
Technical tools may be supplemented with the choice of the strategy in the form of a confirmation for the reversal. These tools may include the breakout strategy or the oscillator. As explained in the previous section, traders generally consider the high point of the bearish engulfing pattern in the form of an area of resistance.
The bearish engulfing pattern is a reversal pattern which gives control to sellers for the duration of the pattern. Understanding the pattern requires that it is not studied in isolation. Market movement before and after the pattern must be closely mapped with the pattern itself.
Short trades are characteristic to the bearish engulfing pattern. Aggressive traders may initiate transactions on the same day, as soon as the conditions of this pattern are validated. Conservative traders usually initiate transactions right after the formation of the second candle.
Stock traders may also make use of several technical indicators to confirm the validity of the bearish engulfing pattern. These indicators include stochastic, volume, MACD, or RSI. A confirmation of this pattern implies that the trader can quickly understand even slight changes in the trend, and take action on the sell signal.
Moreover, a rise in volume on the third day of the formation of this pattern is a confirmation that this pattern is reliable. Furthermore, gap down in price rise provides evidence for a possible trend reversal.
In case you are thinking of getting started with stock market investments or trading, let us assist you in taking the next steps forward:
More on Share Market Education
In case you are looking to learn more about Chart Patterns, here are some reference articles for you:
Summary
Reviewer
A Digital Blogger
Date
Broker Name
Bearish Engulfing Pattern
Overall Rating
