


Looking for Low Brokerage, High Margin & Free Tips?
Doji Star Bearish
| | Chart Patterns | No Comments
More Chart Patterns
Doji star bearish candlestick pattern is a trading pattern that is used in technical analysis of stocks for determining the trend reversal stage. This generally happens after a long uptrend has been witnessed in stock price.
Let us first try to understand what exactly is the meaning of Doji Star Bearish Candlestick Pattern, how and when is it formed along with the help of an example later.
Doji Star Bearish Meaning
To understand this term thoroughly, one should be able to understand the meaning of “Doji” first.
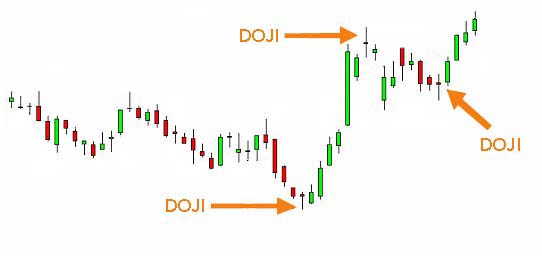
The word Doji has a Japanese origin. It means that in a trading session, the open and closing price of a stock has been virtually the same. Due to this, a Doji pattern looks like a cross in which the body of the candlestick is either very small or almost nonexistent.
The upper and lower shadows of the candle are very much visible giving it the shape of a Doji. Please refer to the picture below to see different types of Doji that can be formed:
Doji Star Bearish Formation
Doji Star Bearish Candlestick Pattern is seen in an uptrend and generally signs the reversal of the trend. Let us find out how we can detect this pattern to initiate a trade.
Step 1
It should be a green candlestick on the first day confirming the uptrend and showing that the closing price of the security is greater than the opening price.
The first image of the picture pasted below shows a normal green type of candlestick chart followed by a small Doji.
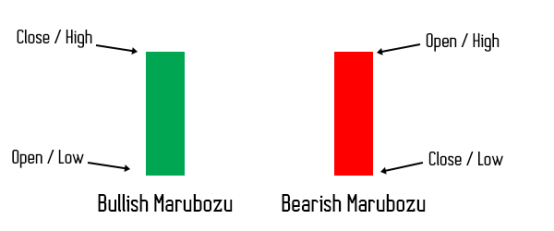
There is one more possibility of the appearance of Doji star bearish candlestick pattern which is that the first candlestick can also be a bullish marubozu candle.
A bullish Marubozu candle means that the opening price of the stock is the low price of the day and the closing price is the high price of the day.
There are no upper and lower shadows in the candlestick charts. The image in the picture posted below shows a bullish marubozu candlestick (and a bearish marubozu candlestick).
Step 2:
On the next day, the stock should have a gap up opening and a Doji is formed showing that the closing and the opening price are almost the same.
This signals that after the long run of the bulls, there is a pressure building up from the bears as well because of which the Doji is formed.
One should note that a small Doji should be formed on the second day which means that the high and low prices should not be too far away from the opening and closing price.
A small Doji looks like a plus sign.
Step 3:
On the next day, the third candlestick should show a gap down opening. And the closing price should be below the midpoint of the gap between the closing price of the candle formed on the first day and the opening price of the candle on the second day.
This is the sign of a trend reversal and this is how a Doji Star Bearish Candlestick Pattern is formed.
This is the pattern which suggests that a trade should be initiated in the opposite direction of the existing trend. In case of a Doji Star Bearish Candlestick Pattern, one should initiate a trade on the short side.
After initiating the trade, stop loss should be fixed at the higher of the last two days high price. A stop loss is triggered if the prices go up instead of going down in the next two days.
This works well in intraday trading. One should check 5 minute and 15 minute time frames to check for this pattern and take positions accordingly.
In order to sell after the formation of this pattern, one should remember that the closing of the new candle of Doji star bearish candlestick pattern should be below the low price of the first candlestick as this is the true sign and confirmation of trend reversal.
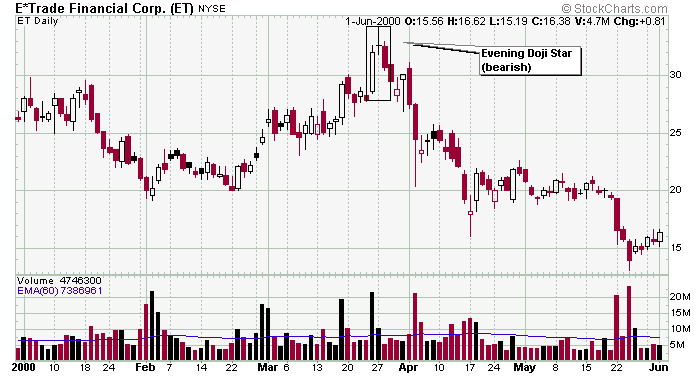
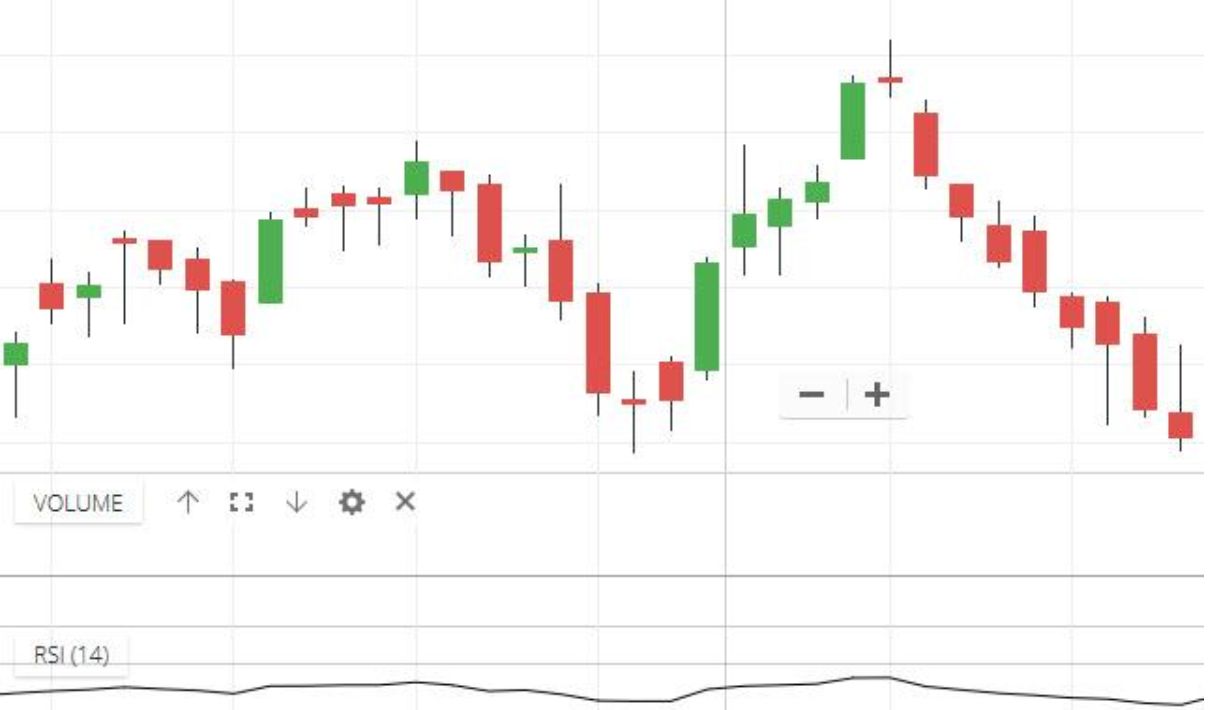
Now, let us see how a Doji star bearish candlestick pattern looks like in a real chart. In the chart below, one can see that after a long uptrend, this pattern is formed which has been marked with red colour.
Just after this pattern is detected on the chart, one can see a trend reversal and the beginning of a long bearish phase.
Tristar Doji
Tristar formations are those patterns where three Doji are formed on three consecutive trading days.
The first Doji signifies the indecision between the bullish and bearish forces and is kind of an equilibrium between the two.
The second Doji marks a gap up opening in the direction of the trend, i.e. bullish.
Lastly, the third Doji signifies the reversal of the trend when the opening price of the candle shows the opposite direction of the prevailing trend. This is called a Tristar formation.
A Doji is very difficult to spot on the charts and therefore, finding a tri-star pattern is also extremely rare to find.
The chart posted above shows a bearish tri-star formation at the top of the uptrend signalling the start of the shift in momentum.
Doji Star Bearish Example
Let us discuss one real-life example of Doji Star Bearish Candlestick Pattern in NIFTY50 that was witnessed in the middle of February 2019.
Please look at the picture posted below to understand its formation.
This is the daily chart of NIFTY50 during the months of January and February 2019. Since the end of January 2019, an uptrend can be seen forming in NIFTY50 levels.
At the top of the trend, a long green candle of the bullish trend can be seen. This is followed by a Doji candlestick the next day.
The opening price of this second-day candle was a gap up from the closing price of the first-day candle. Then, comes the third-day candle which is red in colour meaning that the closing price was lower than the opening price of that day.
This is signalling towards the reversal of the uptrend.
This is the classic Doji Star Bearish Candlestick Pattern.
Had one initiated a short trade on this day, one would have earned significant profits over the next few days because of the continuation of the bearish trend. The next few days can be seen forming many red candles and the prices went down significantly.
Conclusion
Doji Star Bearish Candlestick Pattern is rare to find but if detected properly, one can make a good amount of money by betting according to it. It is generally seen at the top of an uptrend when three candlesticks of the consecutive three days form this pattern.
The first candle signifies an equilibrium between the bulls and the bears.
The first candle can either be a normal green candle or a bullish marubozu candle. The second one shows a gap up opening in the direction of the trend and a small Doji formation with it. Finally, the third one confirms the reversal of the direction of the trend.
Tristar formation is a similar pattern where all the three candles should be Doji. This works similar to Doji star bearish candlestick pattern and signals the reversal of the prevailing trend.
One should have a lot of practice to identify such trends and initiate trades along with strict stop losses to protect oneself from huge losses if the prices start to move in the unfavourable direction due to any reason.
In stock markets, there is never a 100% probability of winning every trade, no matter how experienced and wise a player is.
Stay alert, stay rich!
In case you are looking to get started with stock market trading or investments in general, let us assist you in taking the next steps ahead.
Just fill in a few basic details to get started:
More on Stock Market Education
If you wish to know more about the stock market fundamentals, here are a few references for you:
Summary
Reviewer
A Digital Blogger
Date
Broker Name
Doji Star Bearish
Overall Rating
