


Looking for Low Brokerage, High Margin & Free Tips?
Doji Star Bullish
| | Chart Patterns | No Comments
More Chart Patterns
Doji Star Bullish Candlestick Pattern is used in technical analysis of stocks for determining when the trend is going to reverse after a long downtrend has been witnessed in the stock price. Let us first try to understand what exactly is the meaning of Doji Star Bullish candlestick Pattern.
In order to grasp its meaning, one should first try to comprehend the meaning of “Doji”.
Doji is a Japanese word. Its literal meaning is a blunder or a mistake. It basically refers to the rare event of opening and closing price of a security to be almost same.
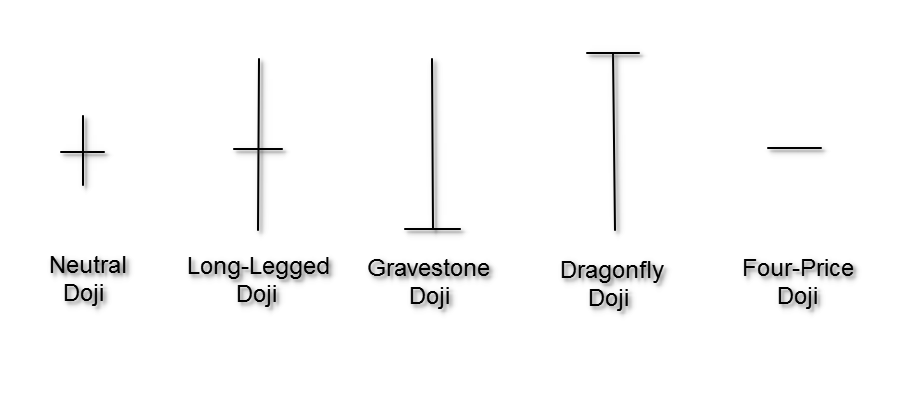
A Doji pattern is said to be formed when on a certain trading day, the closing, as well as the opening price, are more or less at the same level. It looks like a plus (+) sign or a cross where the body of the candle is very small or nonexistent. The upper and lower shadows of the candle can be seen.
There can be different types of Doji that can be formed.
Please look at the picture posted below to have a brief idea about how Doji may look like on a chart.
Doji Star Bullish Formation
Doji Star Bullish Candlestick Pattern is seen in a downtrend and generally signs the reversal of a trend.
It is seen mostly on the bottom of the chart. It signals the end of the bearish phase and the beginning of the arrival of the bulls in the market. Let us find out how we can detect this pattern in daily charts of indices or stocks in order to initiate a trade.
Step 1
It should be a normal red candlestick on the first day confirming the downtrend and showing that the closing price of the security is lesser than the opening price.
The first image of the picture pasted after the explanation shows a normal red candlestick followed by a small Doji.
There is one more possibility of the appearance of Doji star bullish candlestick pattern which is that the first candlestick can also be a bearish marubozu candle. A bearish Marubozu candle means that the opening price of the stock is the high price of the day and the closing price is the low price of the day.
There is just the body of the candlestick charts.
There are no upper and lower shadows in the candlestick. The second image in the picture posted after the explanation shows a bearish marubozu candlestick.
Step 2
On the second trading day, the stock price should have a gap down opening and a Doji should be formed showing that the closing and the opening price are almost the same.
Gap down opening means that the closing price of the previous trading day should be more than the opening price of the second day. Alternatively, the opening price should be equal to the closing price of the previous day.
This signals that after the long run of the bears, there is a pressure building up from the bulls as well because of which the Doji is formed.
One should note that a small Doji should be formed on the second day which means that the high and low prices should not be too far away from the opening and closing price.
A small Doji looks like a plus sign.
Step 3
On the next day, the third candlestick should show a gap up opening. This is the sign of a trend reversal and this is how a Doji Star Bullish Candlestick Pattern is formed.
This is the pattern which suggests that a trend reversal is about to happen and trade should be initiated in the opposite direction of the existing trend.
In case of a Doji Star Bullish Candlestick Pattern, one should initiate a trade on the long side and also keep a stop loss just in case the stock price starts to move in an unfavourable direction.
This works well in intraday trading. One should check 5 minute and 15 minute time frames to check for this pattern and take positions accordingly.
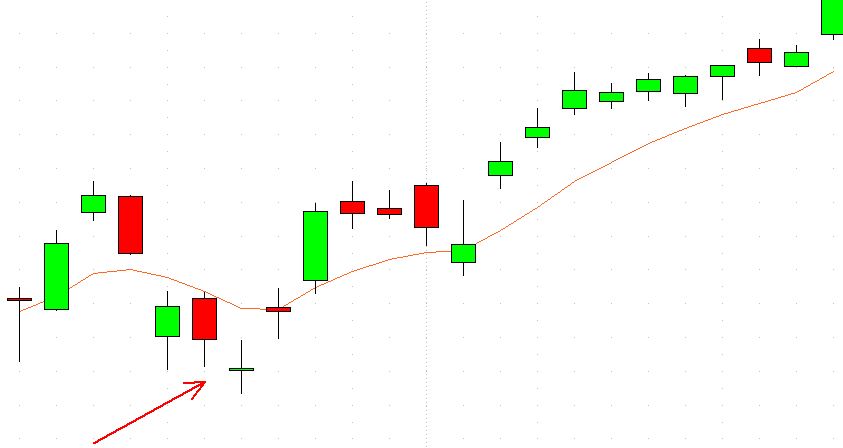
Now, let us see how Doji star bullish candlestick pattern looks like in a real intraday chart and how it signals a trend reversal.
The red line in the picture posted above shows how a Doji star bullish candlestick pattern has been formed which is followed by a long up move in the stock price. Had one initiated a trade in the long side after getting the confirmation from this pattern, one would have been able to gain a huge profit.
Bullish Tri – Star Formation
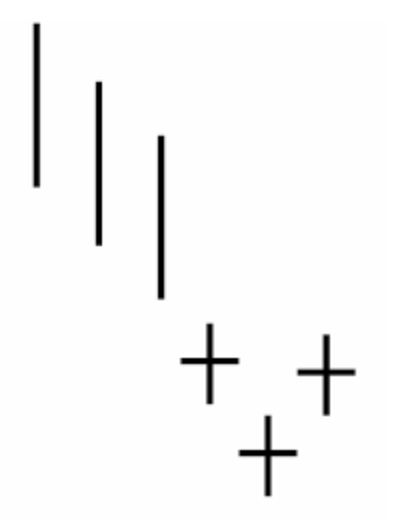
Tristar formations are the candlestick patterns where three Doji candles are formed on three consecutive trading days.
The first Doji shows the indecision in the market between the bulls and bears. This is kind of an equilibrium between the two.
The second Doji marks a gap down opening in the direction of the trend, i.e. bearish.
Lastly, the third Doji signifies the reversal of the trend when the opening price of the candle is higher than the previous high price and shows the opposite direction of the prevailing trend.
This is called a Tristar formation. It is extremely rare to find a tri-star formation of charts but when it is found, it is a very strong signal to open positions for a trend reversal.
This is the image of a tri-star formation at the end of a long downtrend and signals the shift in market forces. An uptrend is most likely to follow after this.
Doji Star Bullish Example
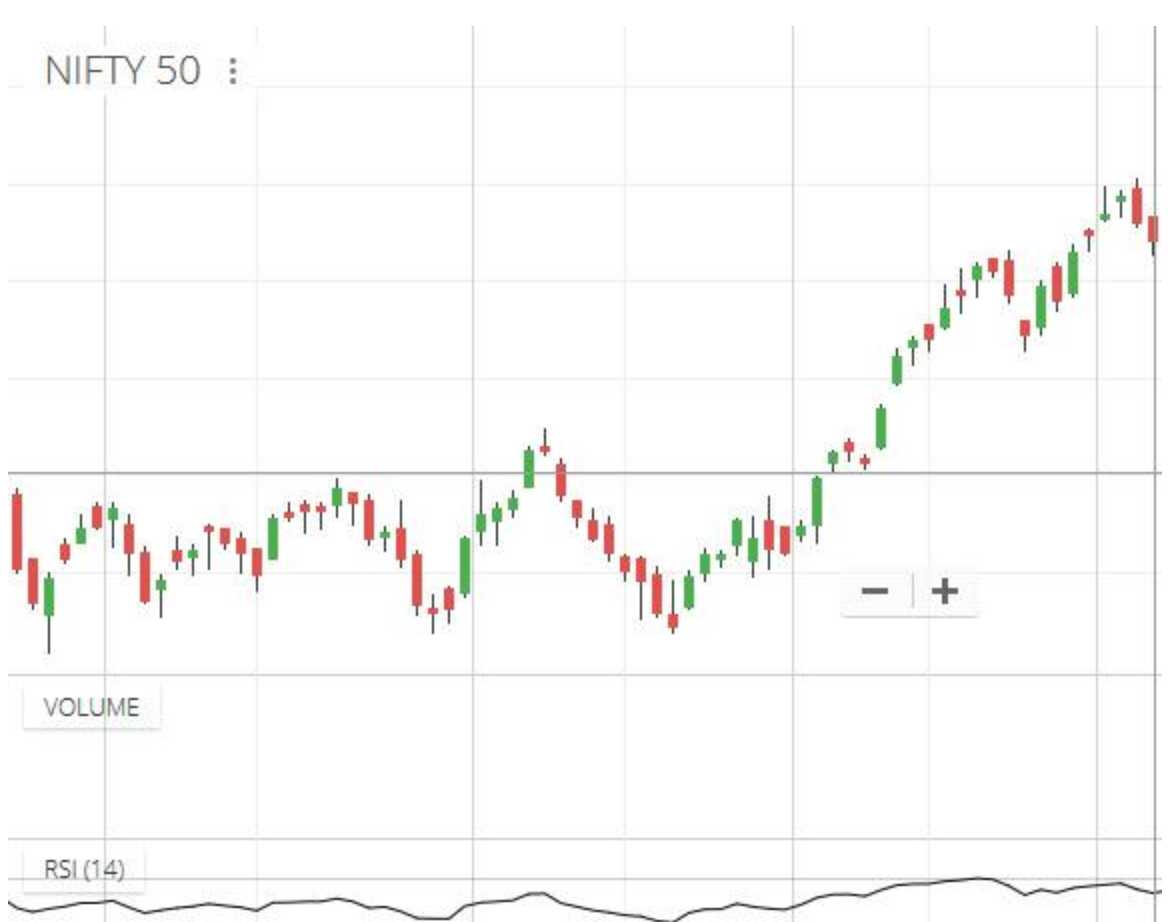
Let us discuss one real-life example of Doji Star Bullish Candlestick Pattern in NIFTY50 that was witnessed in the month of February 2019.
Please look at the picture posted below to understand its formation.
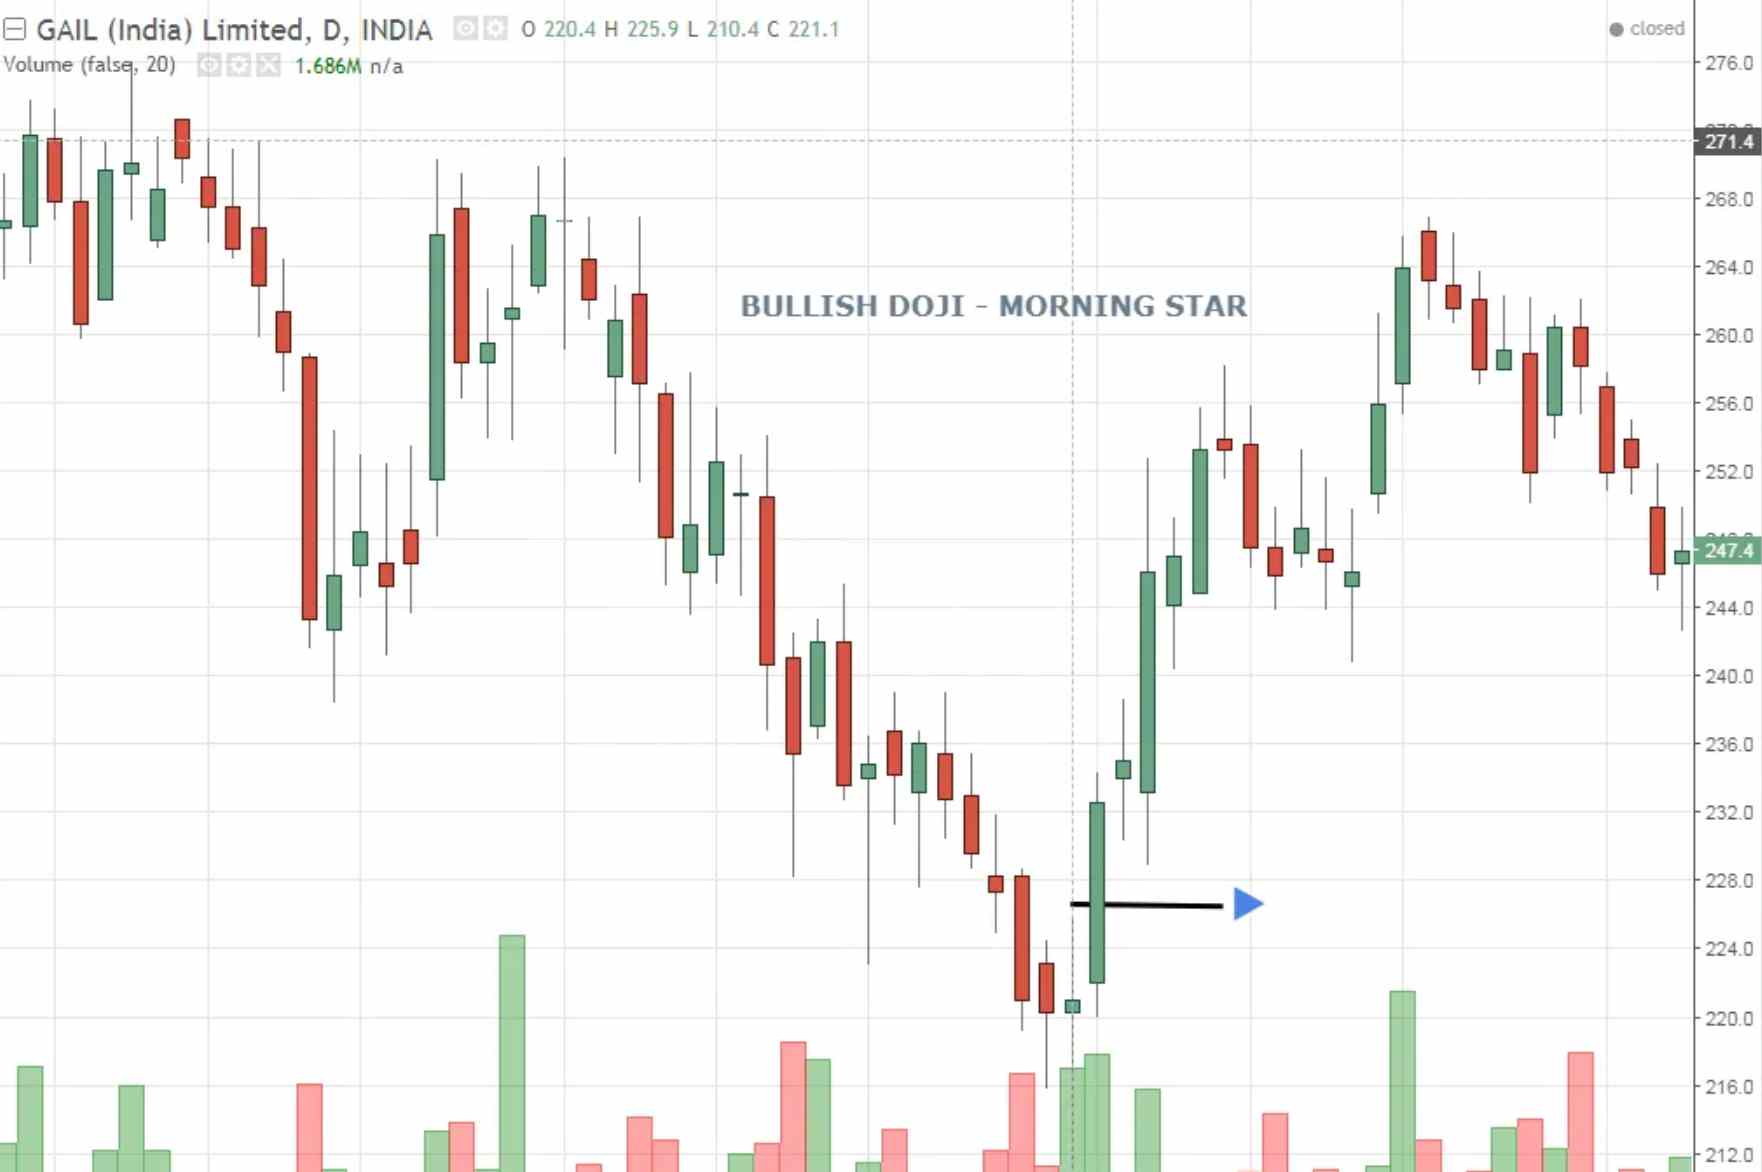
This is the daily chart of NIFTY50 during the months of February 2019 and March 2019. Till the mid of February 2019, a downtrend can be seen forming in NIFTY50 levels.
At the bottom of the trend, a long red candle of the bearish trend can be seen. This is followed by a Doji candlestick with a small body the next day. This is signalling towards the reversal of the downtrend.
The next day, the index showed a gap up opening and the reversal of the previous trend and the beginning of the uptrend can be seen after this. This is the classic Doji Star Bullish Candlestick Pattern.
One should have initiated a long position after mid-February to earn good profits. This has shown a successful working of Doji Star Bullish Candlestick Pattern.
Conclusion
Doji Star Bullish Candlestick Pattern is used in technical analysis to detect when the bearish trend is going to reverse itself. It is seen at the bottom of a downtrend signalling the beginning of the uptrend.
The first candle of this pattern can either be a normal red candle or a bearish marubozu candle which is followed by a second small doji candle which shows indecisiveness in the market.
The opening price of the second day should either be equal to the close of the first day or lower than it (a gap down opening).
The third candle in this pattern gives the confirmation of reversal of the trend.
Bullish tri star formation includes three doji candles made on three consecutive days. This works in the same way as doji star bullish candlestick pattern and signals the beginning of the uptrend after a long downtrend.
One should devote a lot of time to practice trading on the basis of candlestick chart types in technical analysis. Also, every trade should be accompanied by a stop loss to shield oneself from big losses. Stay educated, stay invested!
In case you are looking to get started with stock market trading or investments in general, let us assist you in taking the next steps ahead.
Just fill in a few basic details in the form below to get started:
More on Stock Market Education
If you wish to know more about the stock market fundamentals, here are a few references for you:
Summary
Reviewer
A Digital Blogger
Date
Broker Name
Doji Star Bullish Pattern
Overall Rating
